Silicost
Role
Developer
Team
Solo Project
Timeline
3 Months
Overview
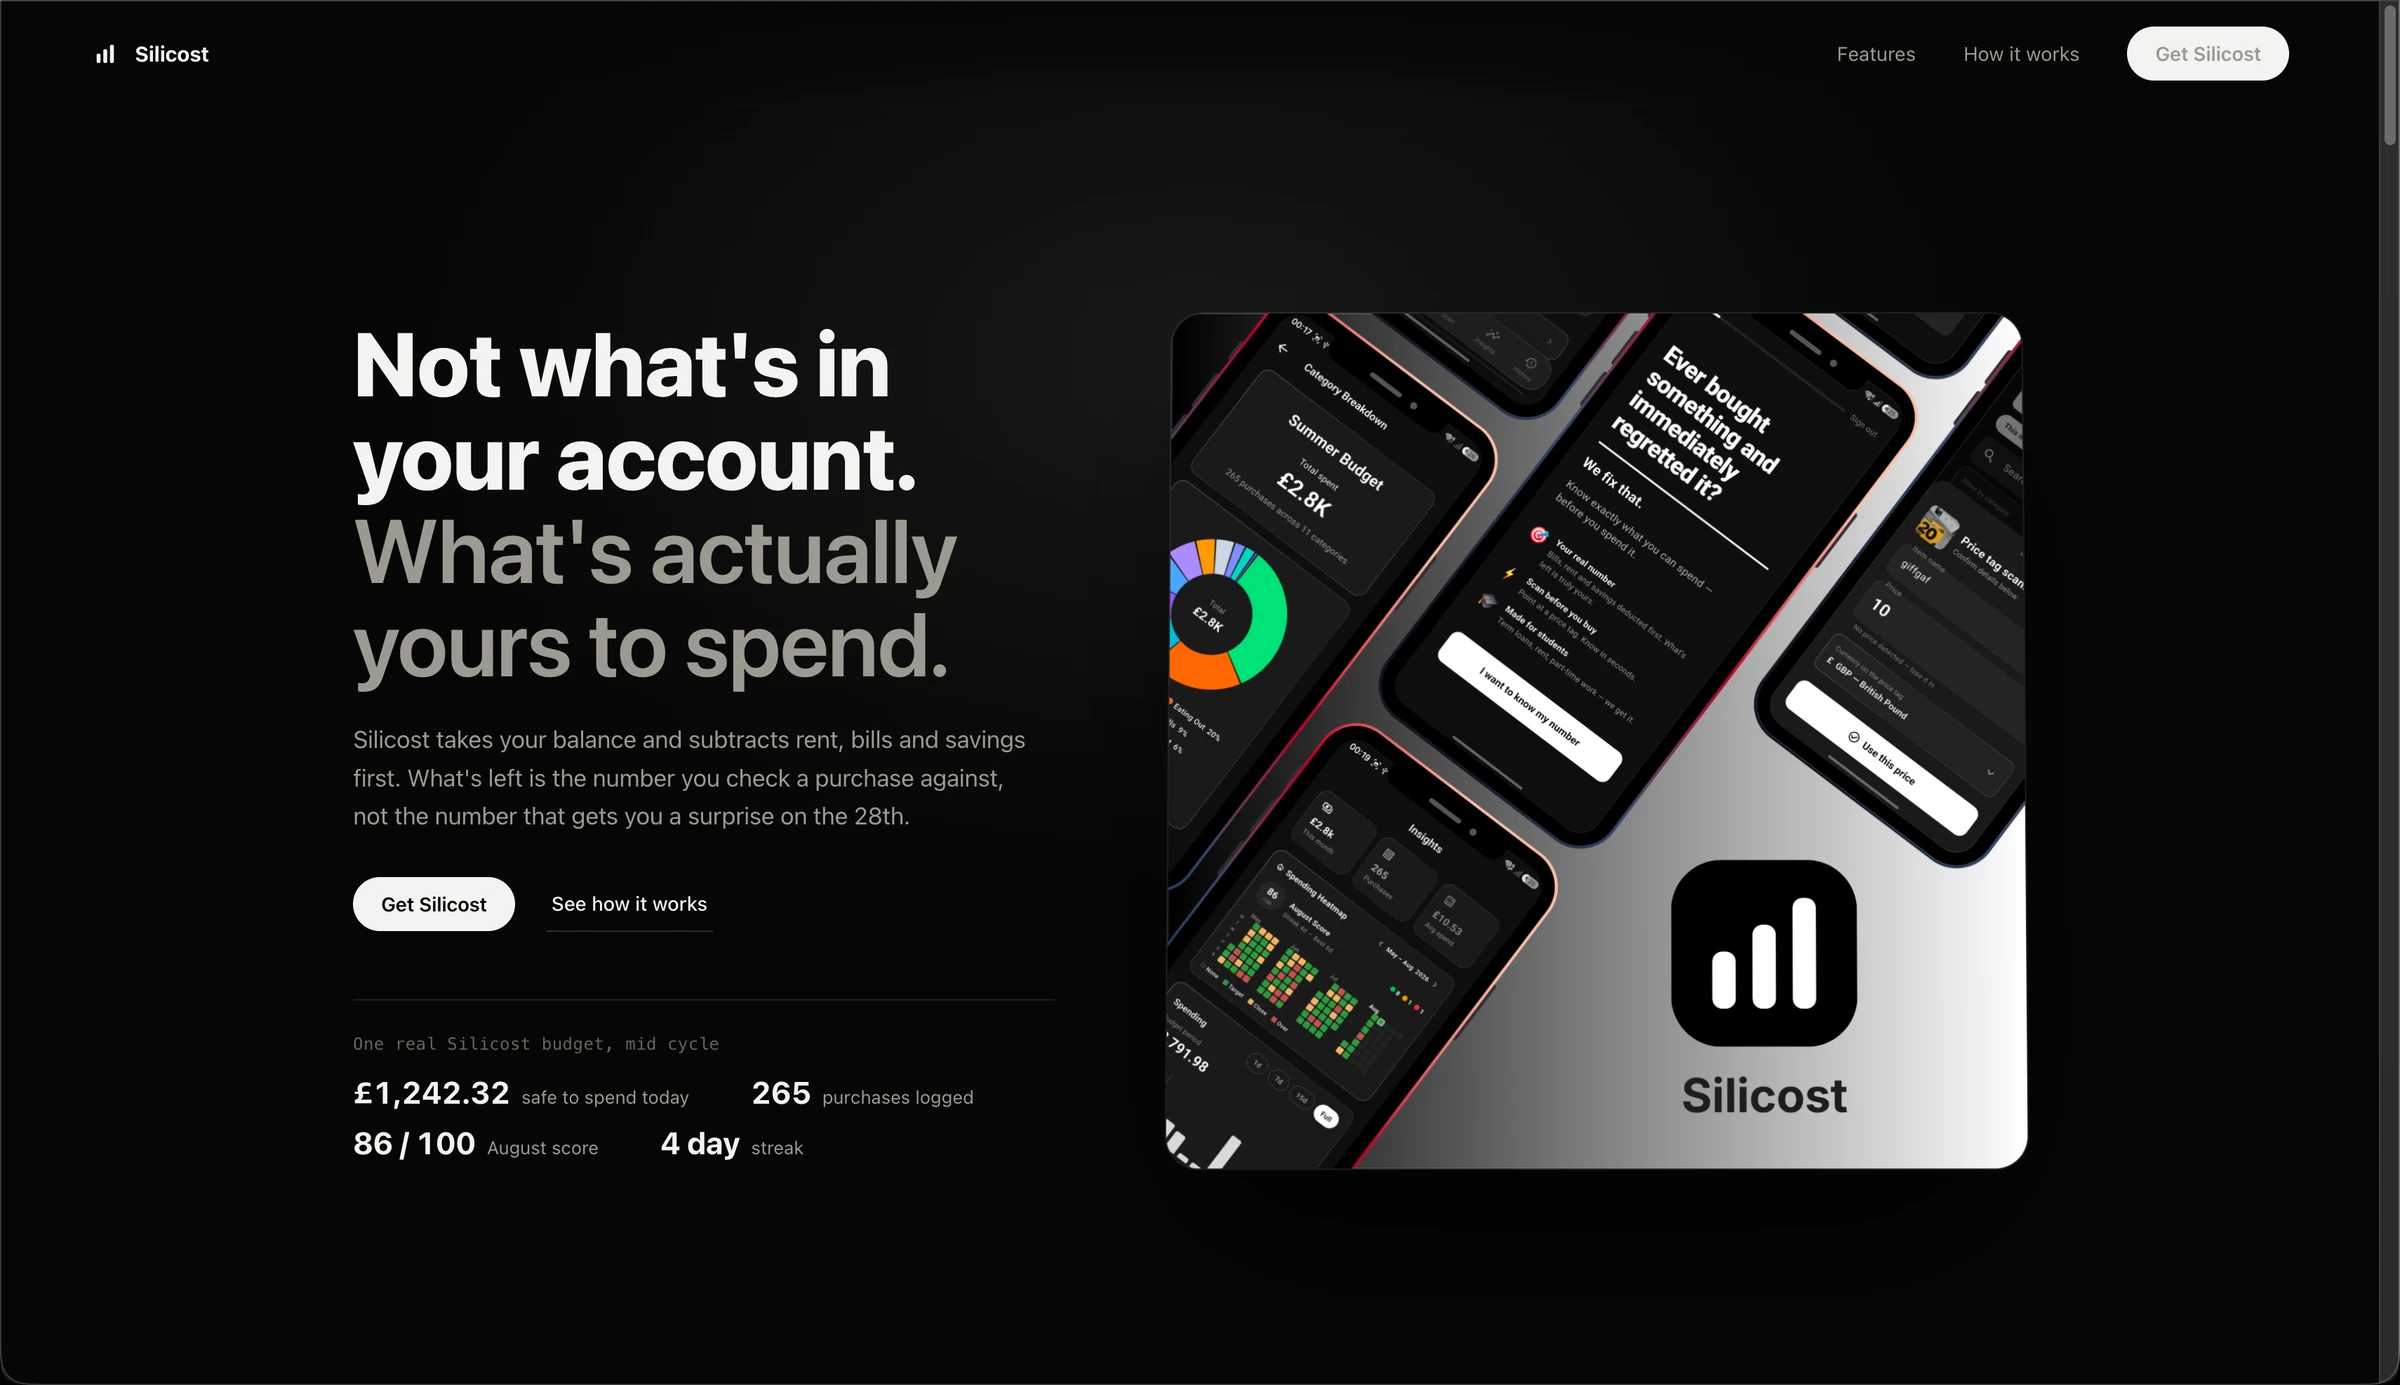
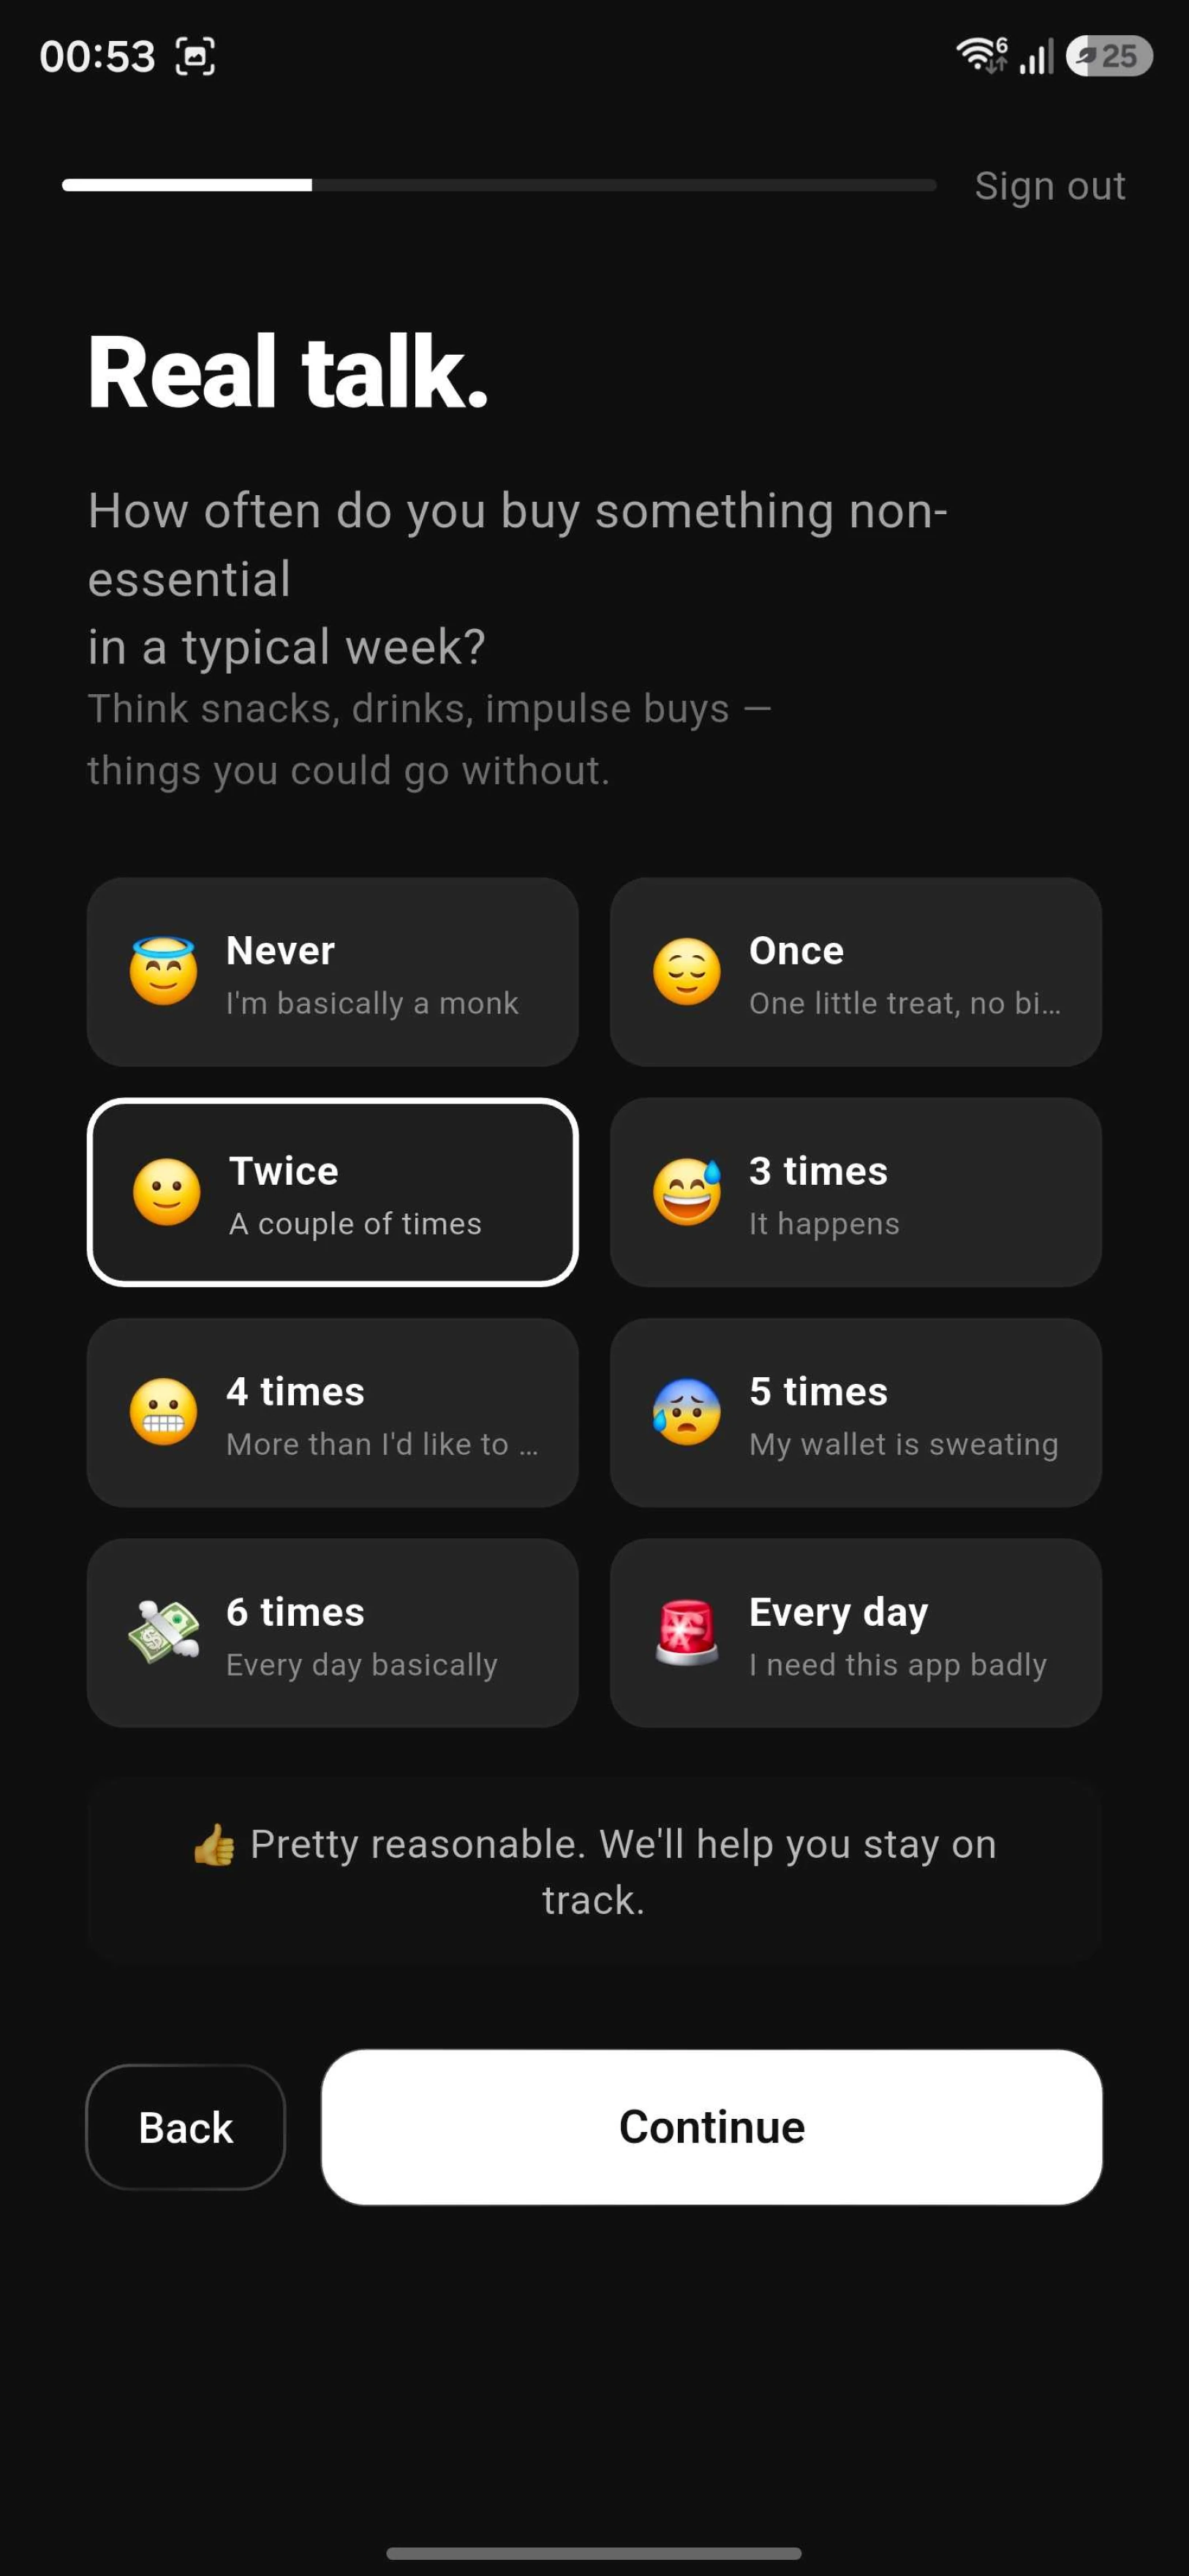
Silicost is a personal budgeting app designed to make everyday spending decisions easier. Instead of relying on complicated budgeting spreadsheets, users can see how much money they have available, their recommended daily spending limit, and how their spending is affecting their overall budget. The app tracks income and expenses, provides statistics and spending breakdowns, and lets users quickly check whether they can afford a purchase based on their current financial position. The goal was to give users a simple overview of their finances and help them understand not just what they can afford now, but how a purchase could affect their spending for the rest of the day and month.
Insights
Insights at a glance
Turn spending data into something you can actually understand.
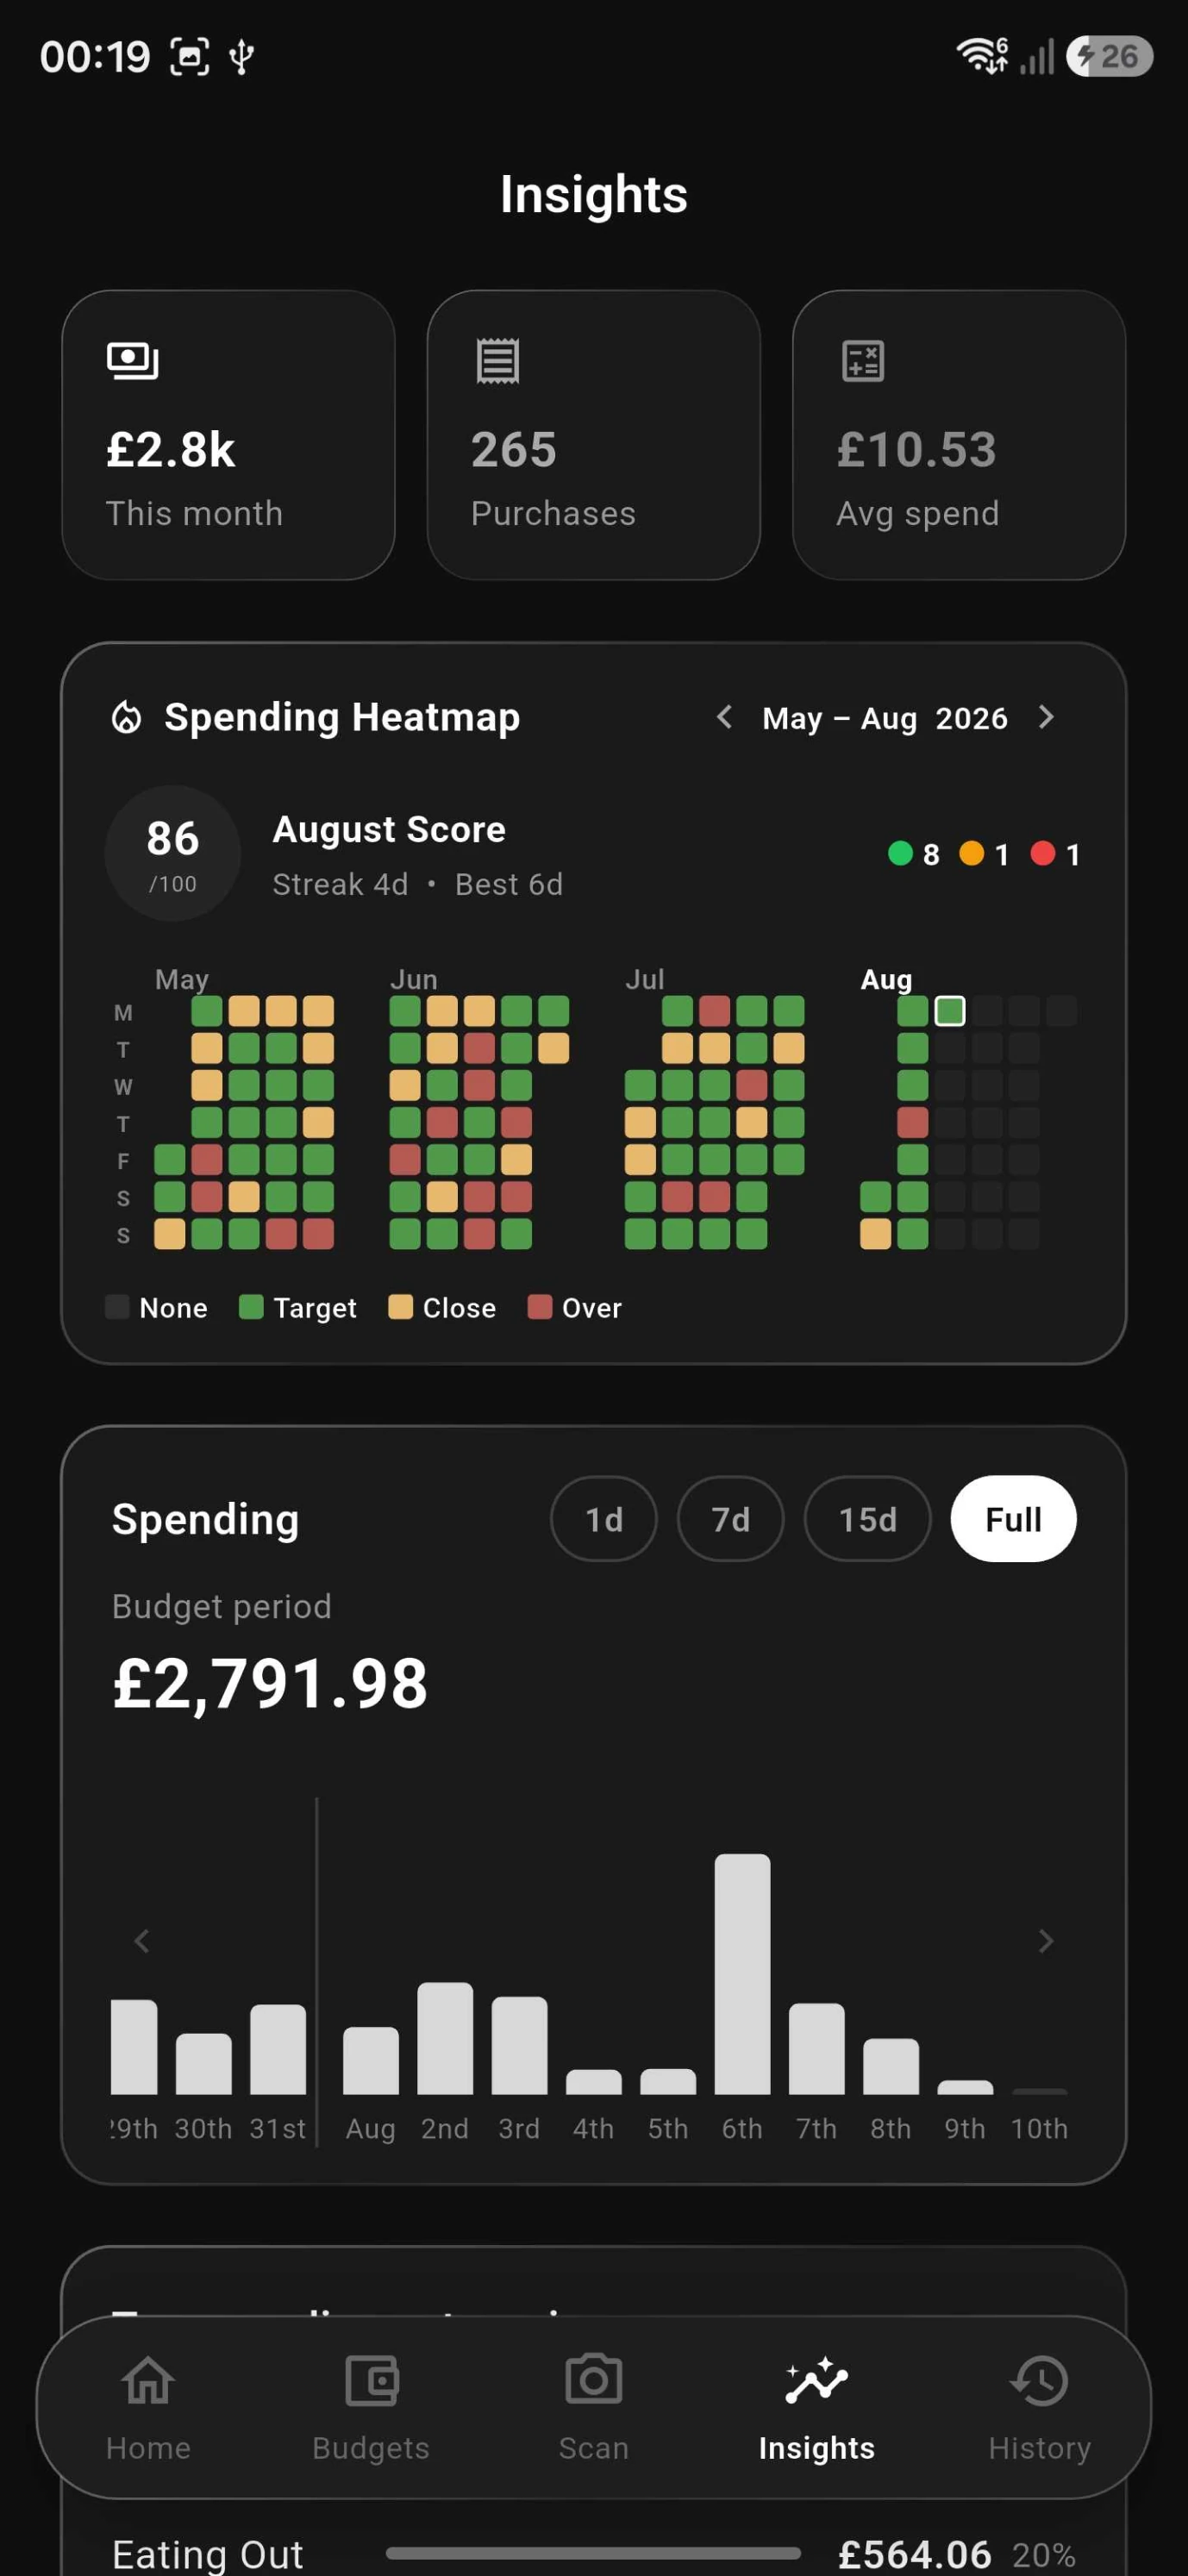
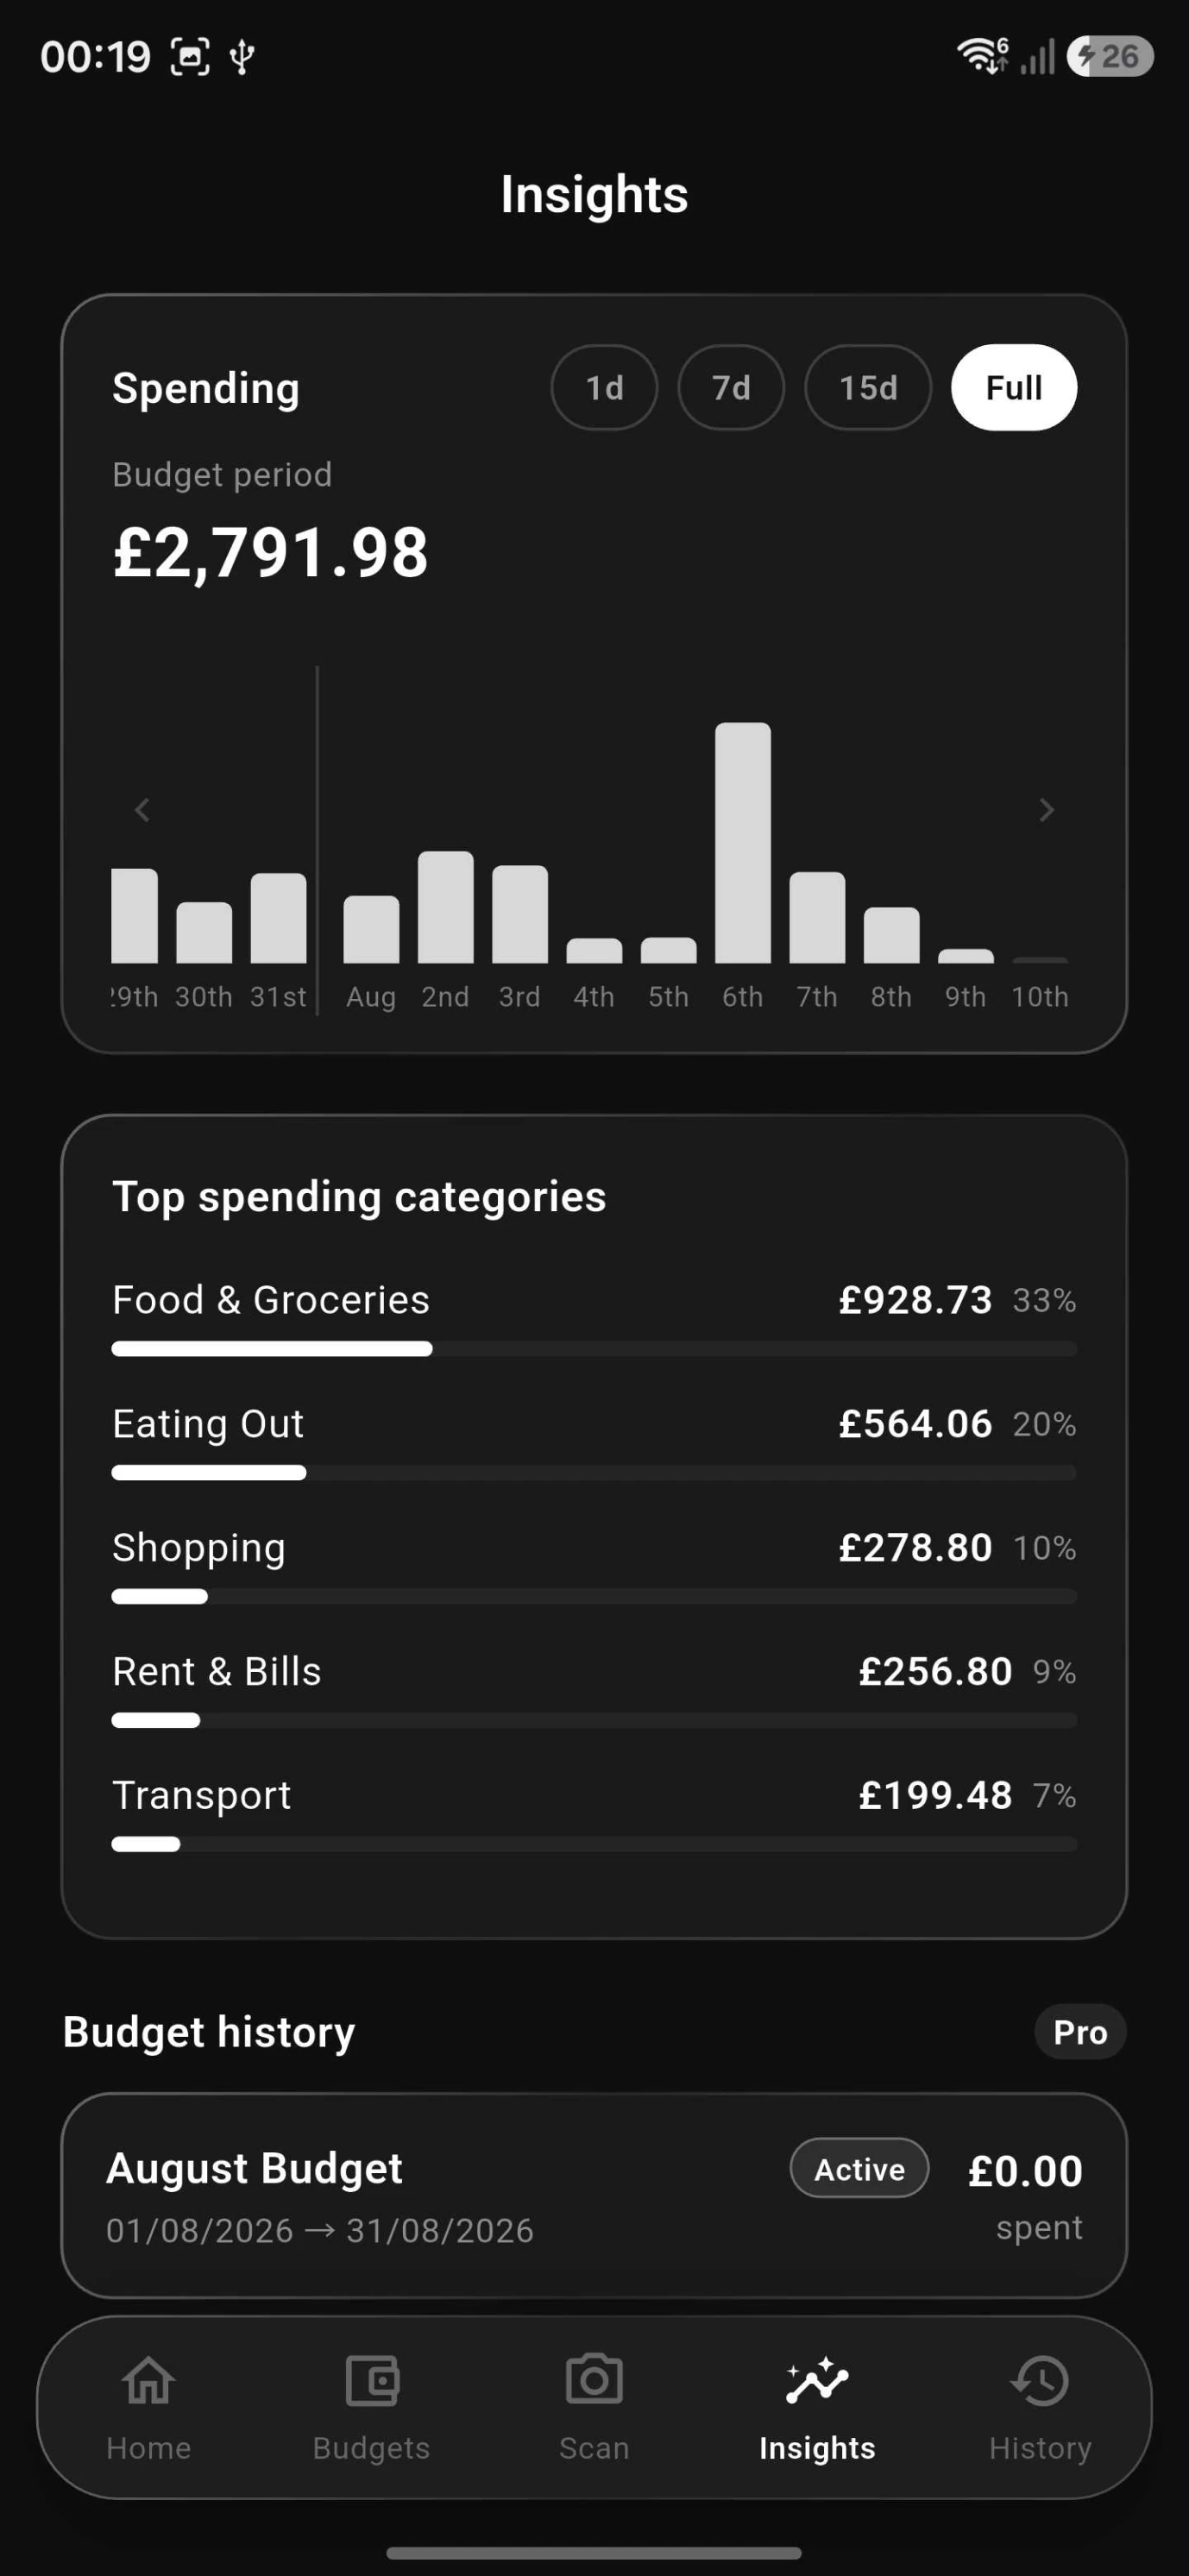
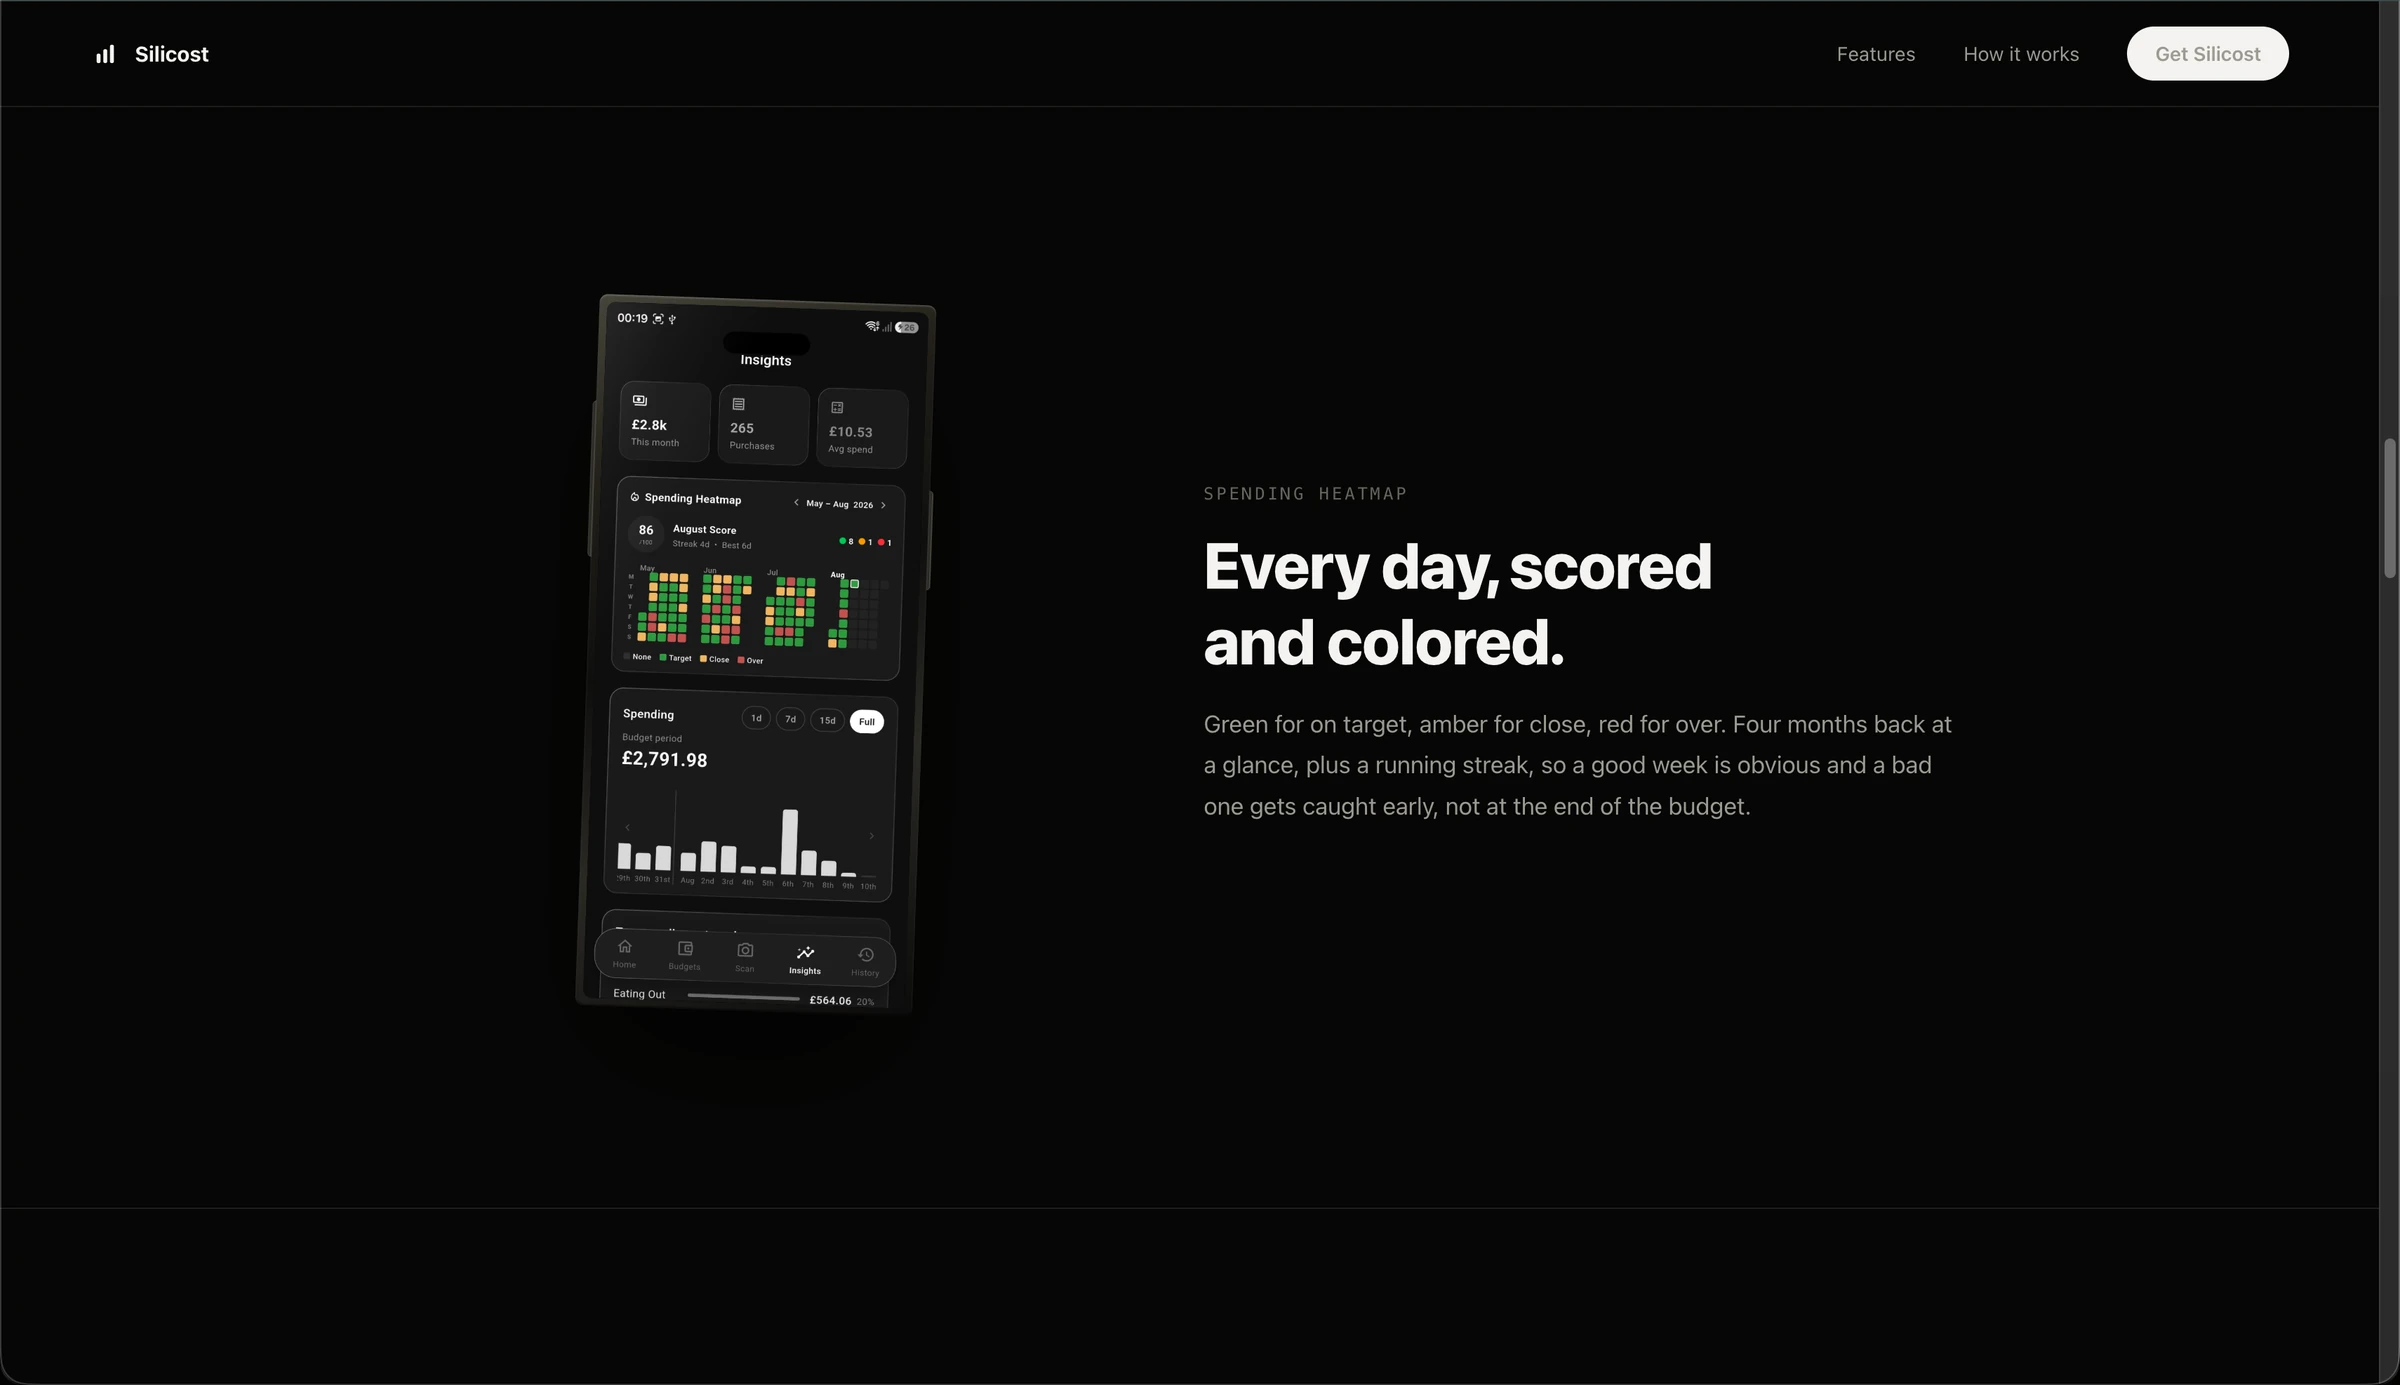
The Insights screen gives users a clear picture of their spending habits over time. It shows how much they have spent to date, their average purchase size, and other key spending statistics. A daily heatmap provides an at-a-glance score for each day, making it easy to spot periods of heavier spending, identify patterns, and understand how consistently they are staying within their budget.
Highlights
Silicost turns everyday spending into a simple, actionable answer: know what you can afford today, and understand how your choices affect your budget tomorrow.
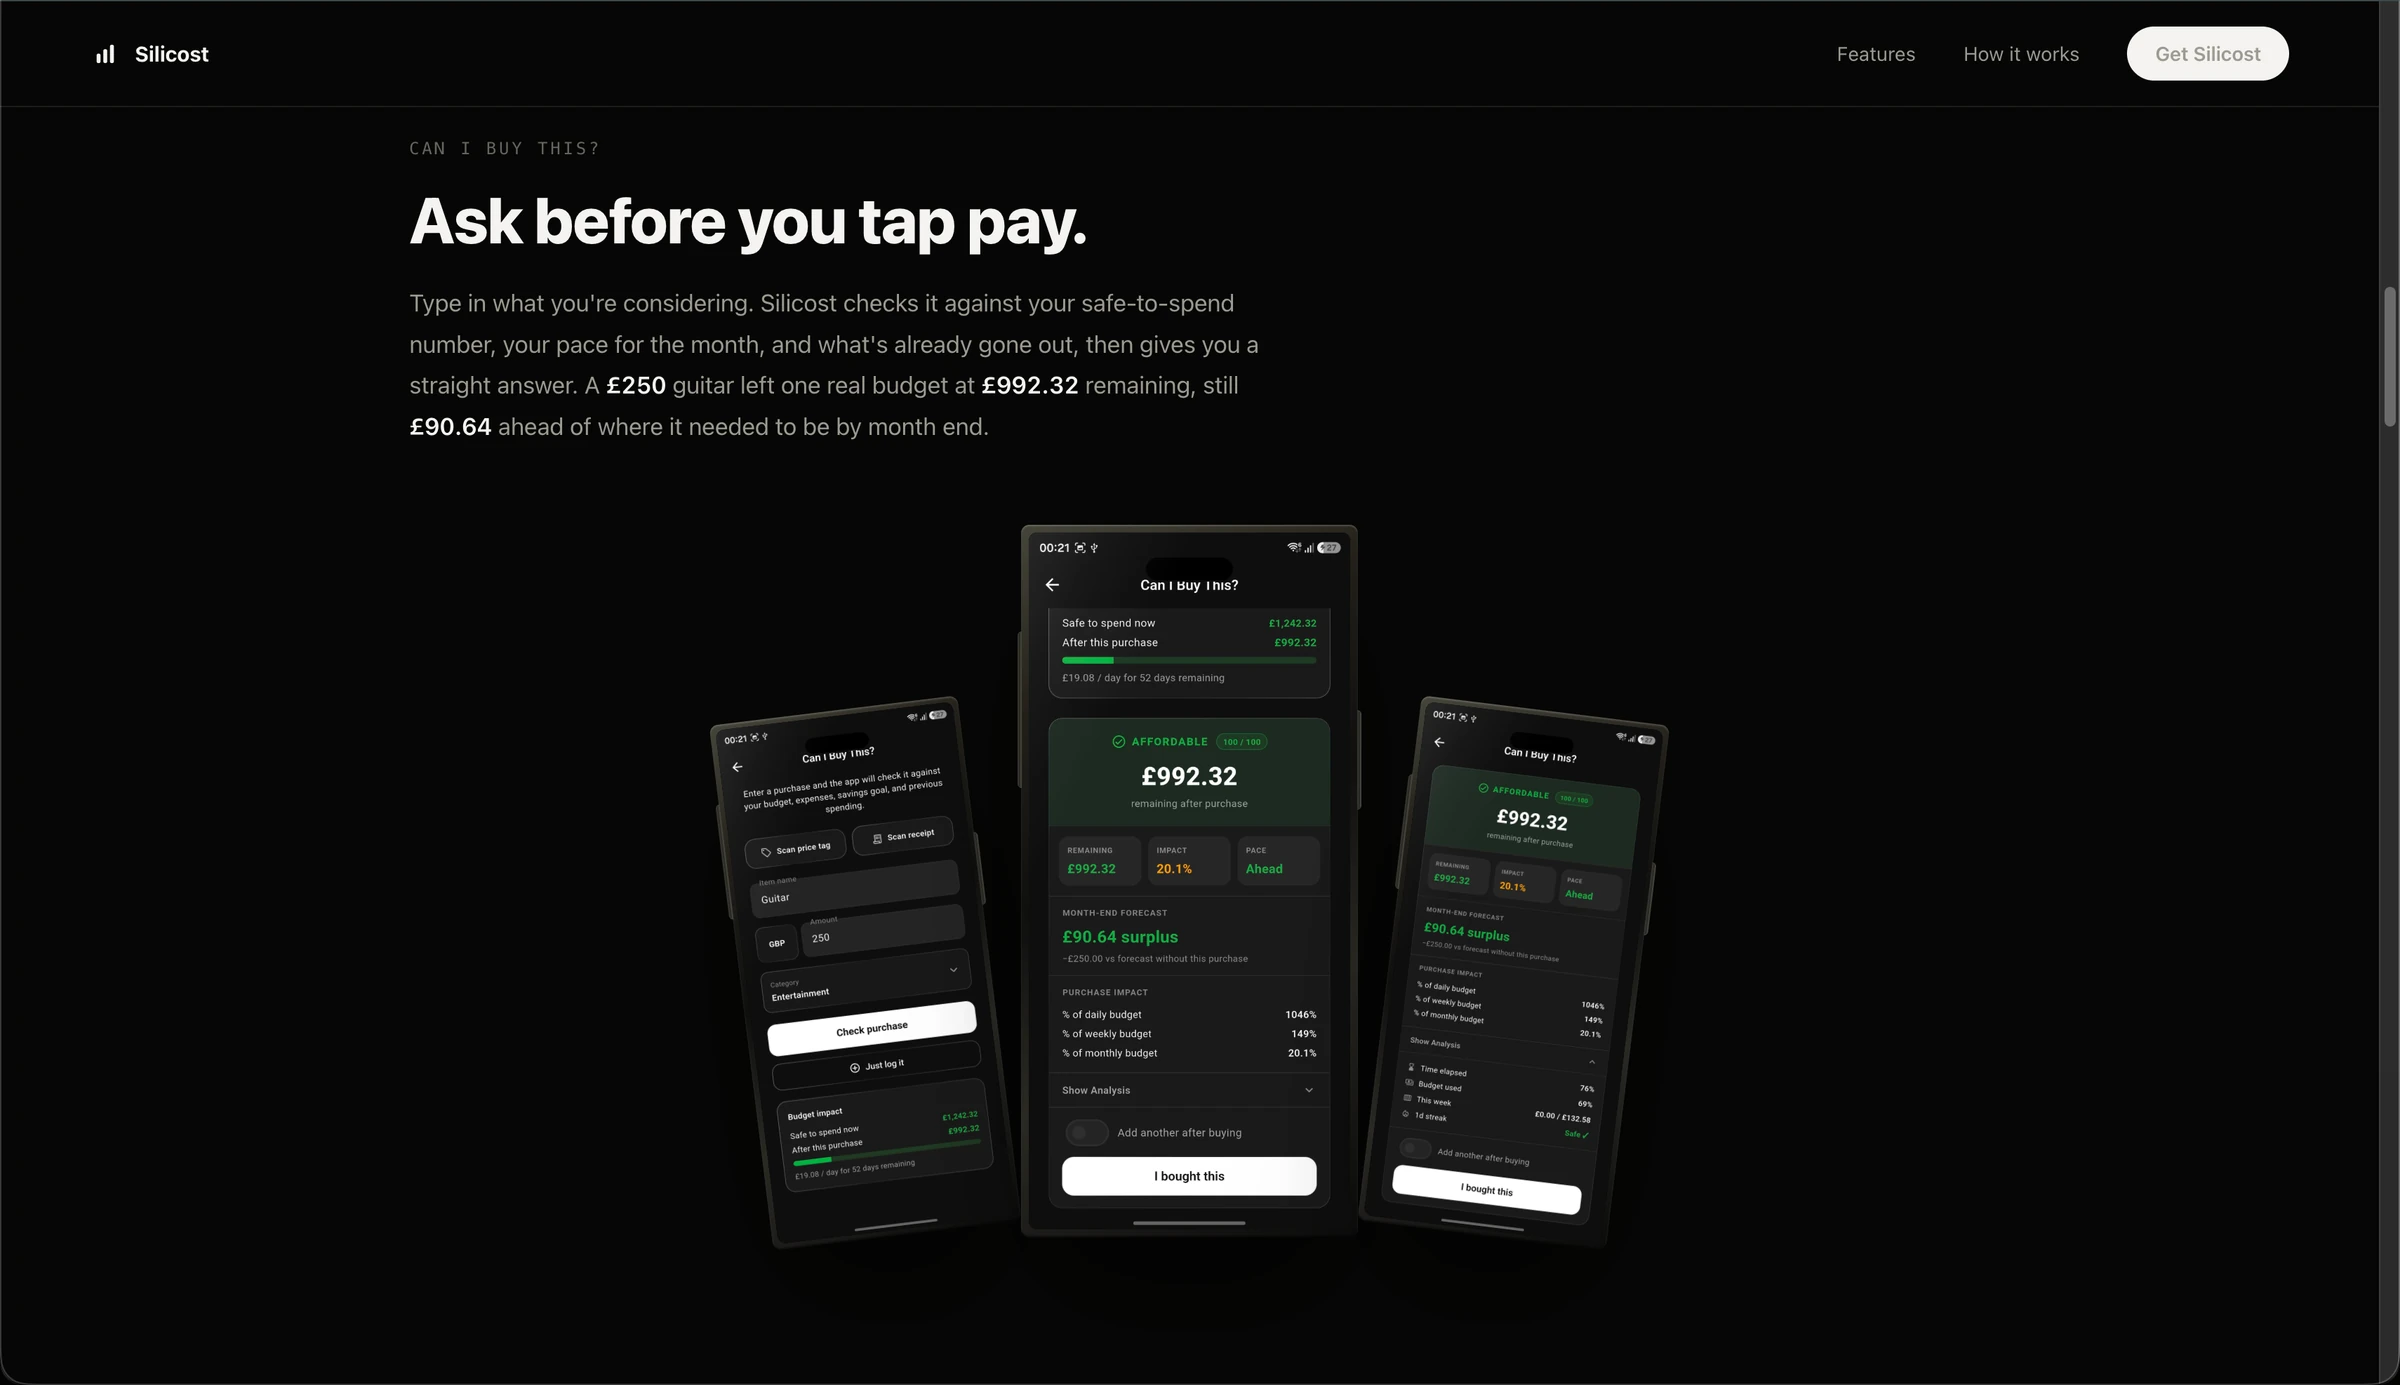
0.1Checking a purchase before you tap pay.
Image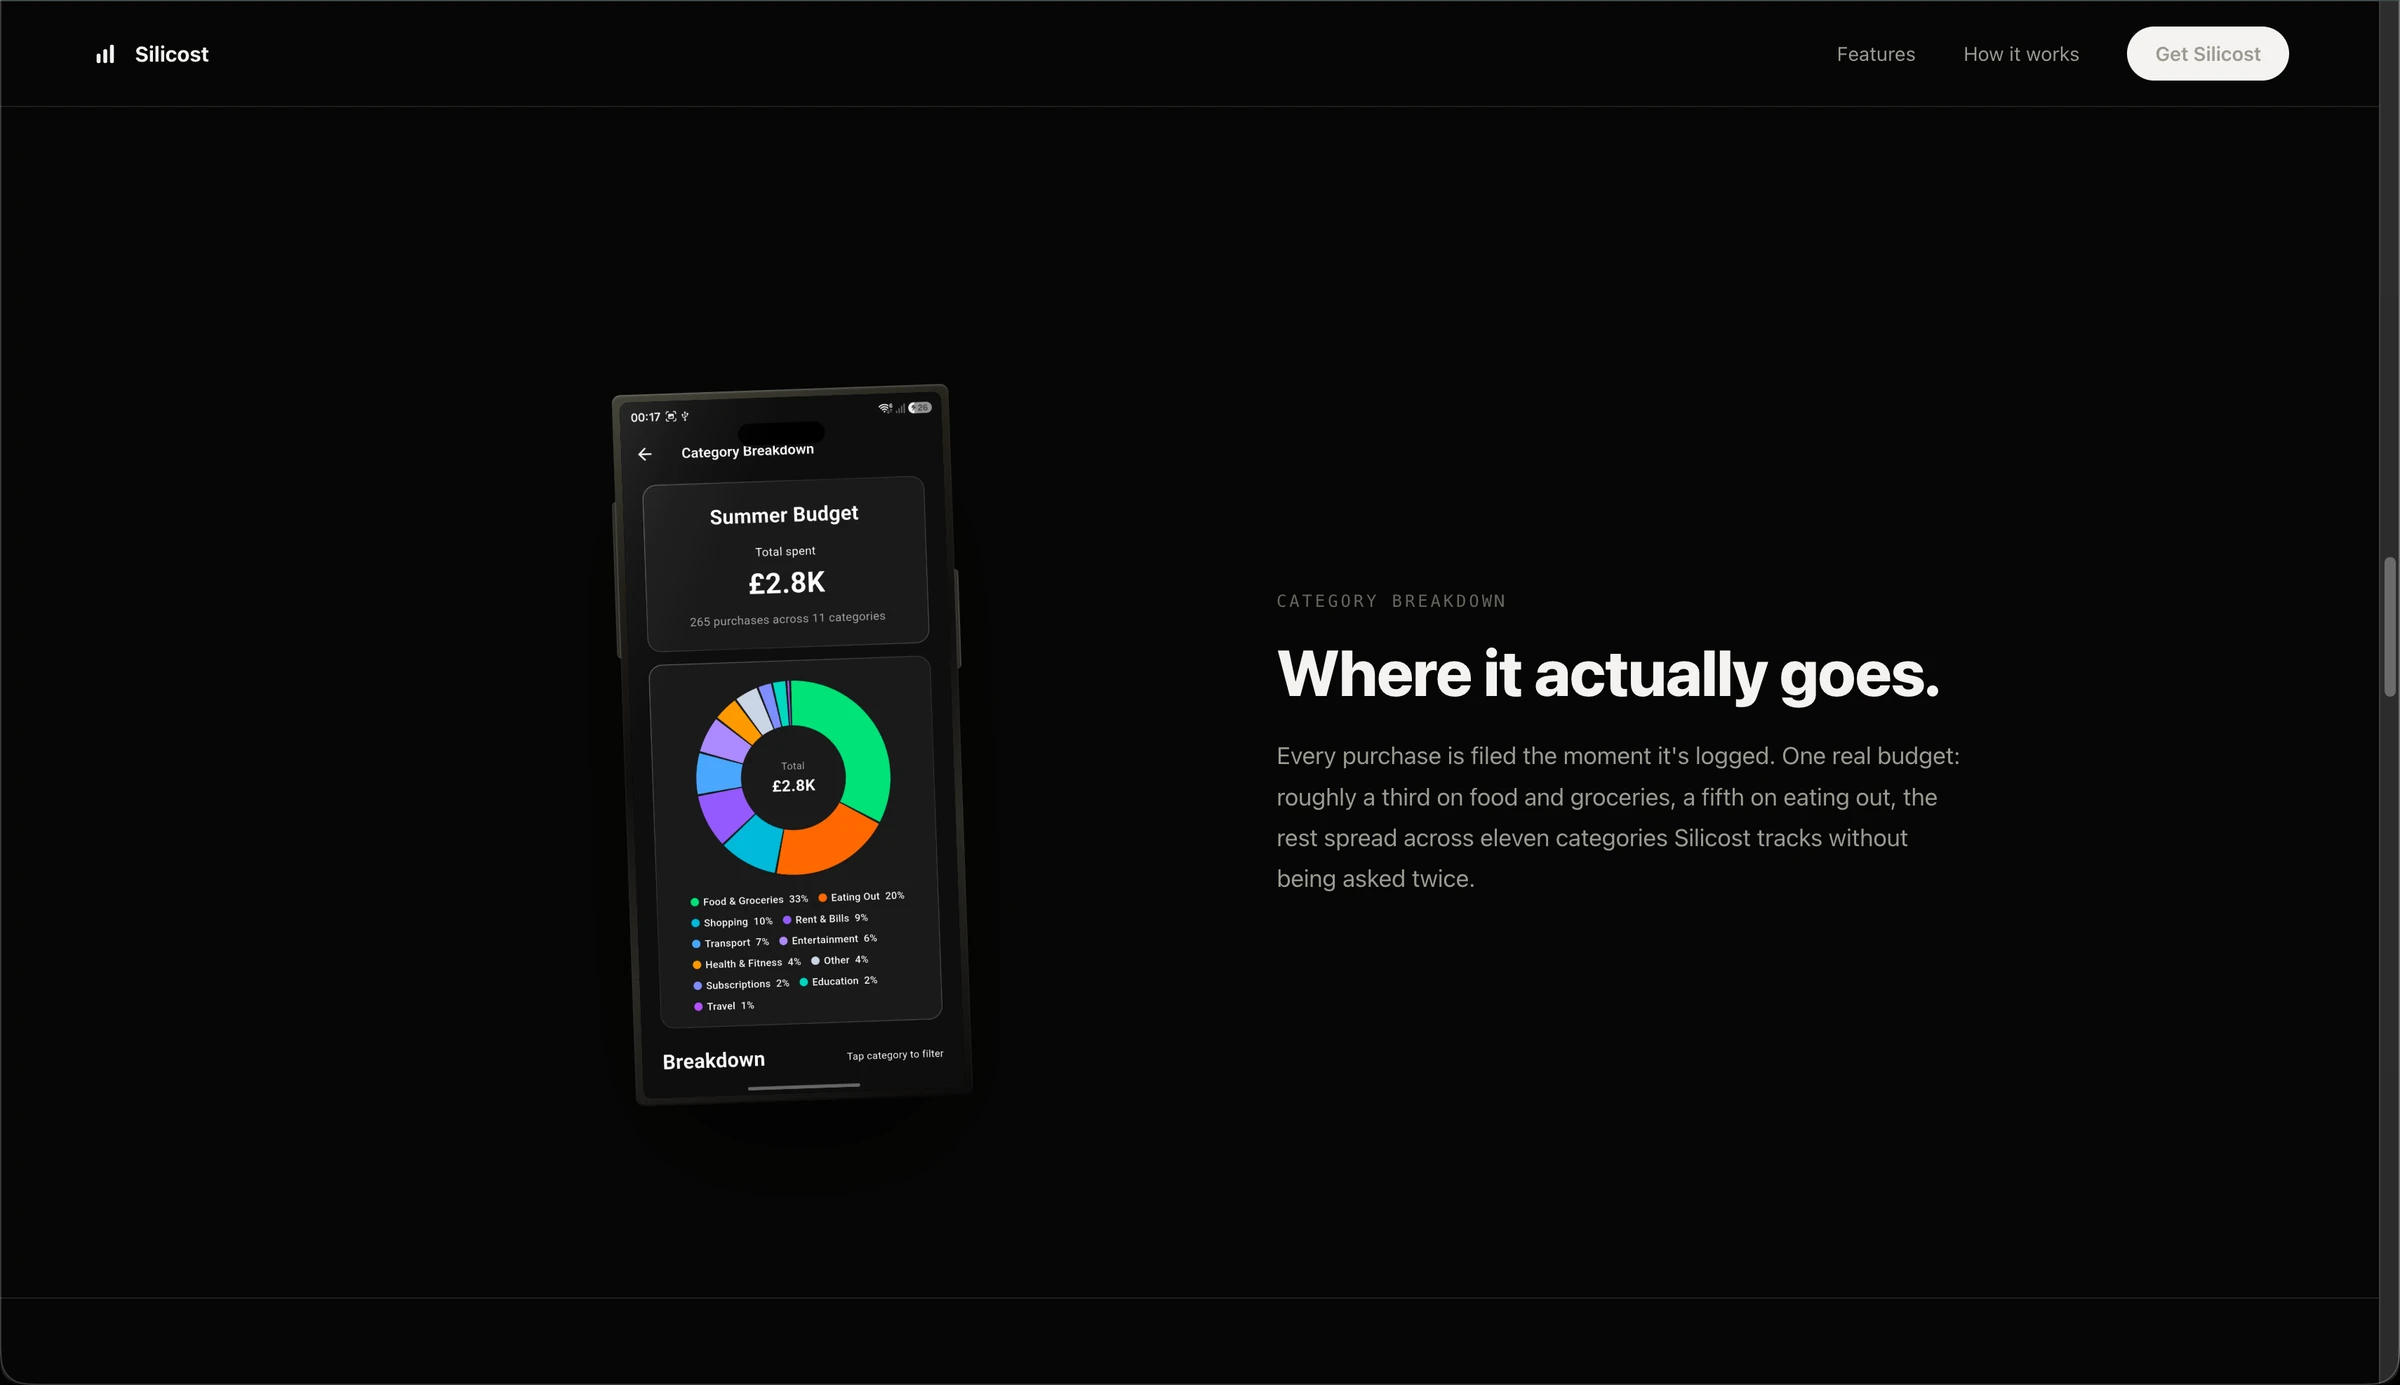
0.2Where the money actually goes, by category.
Image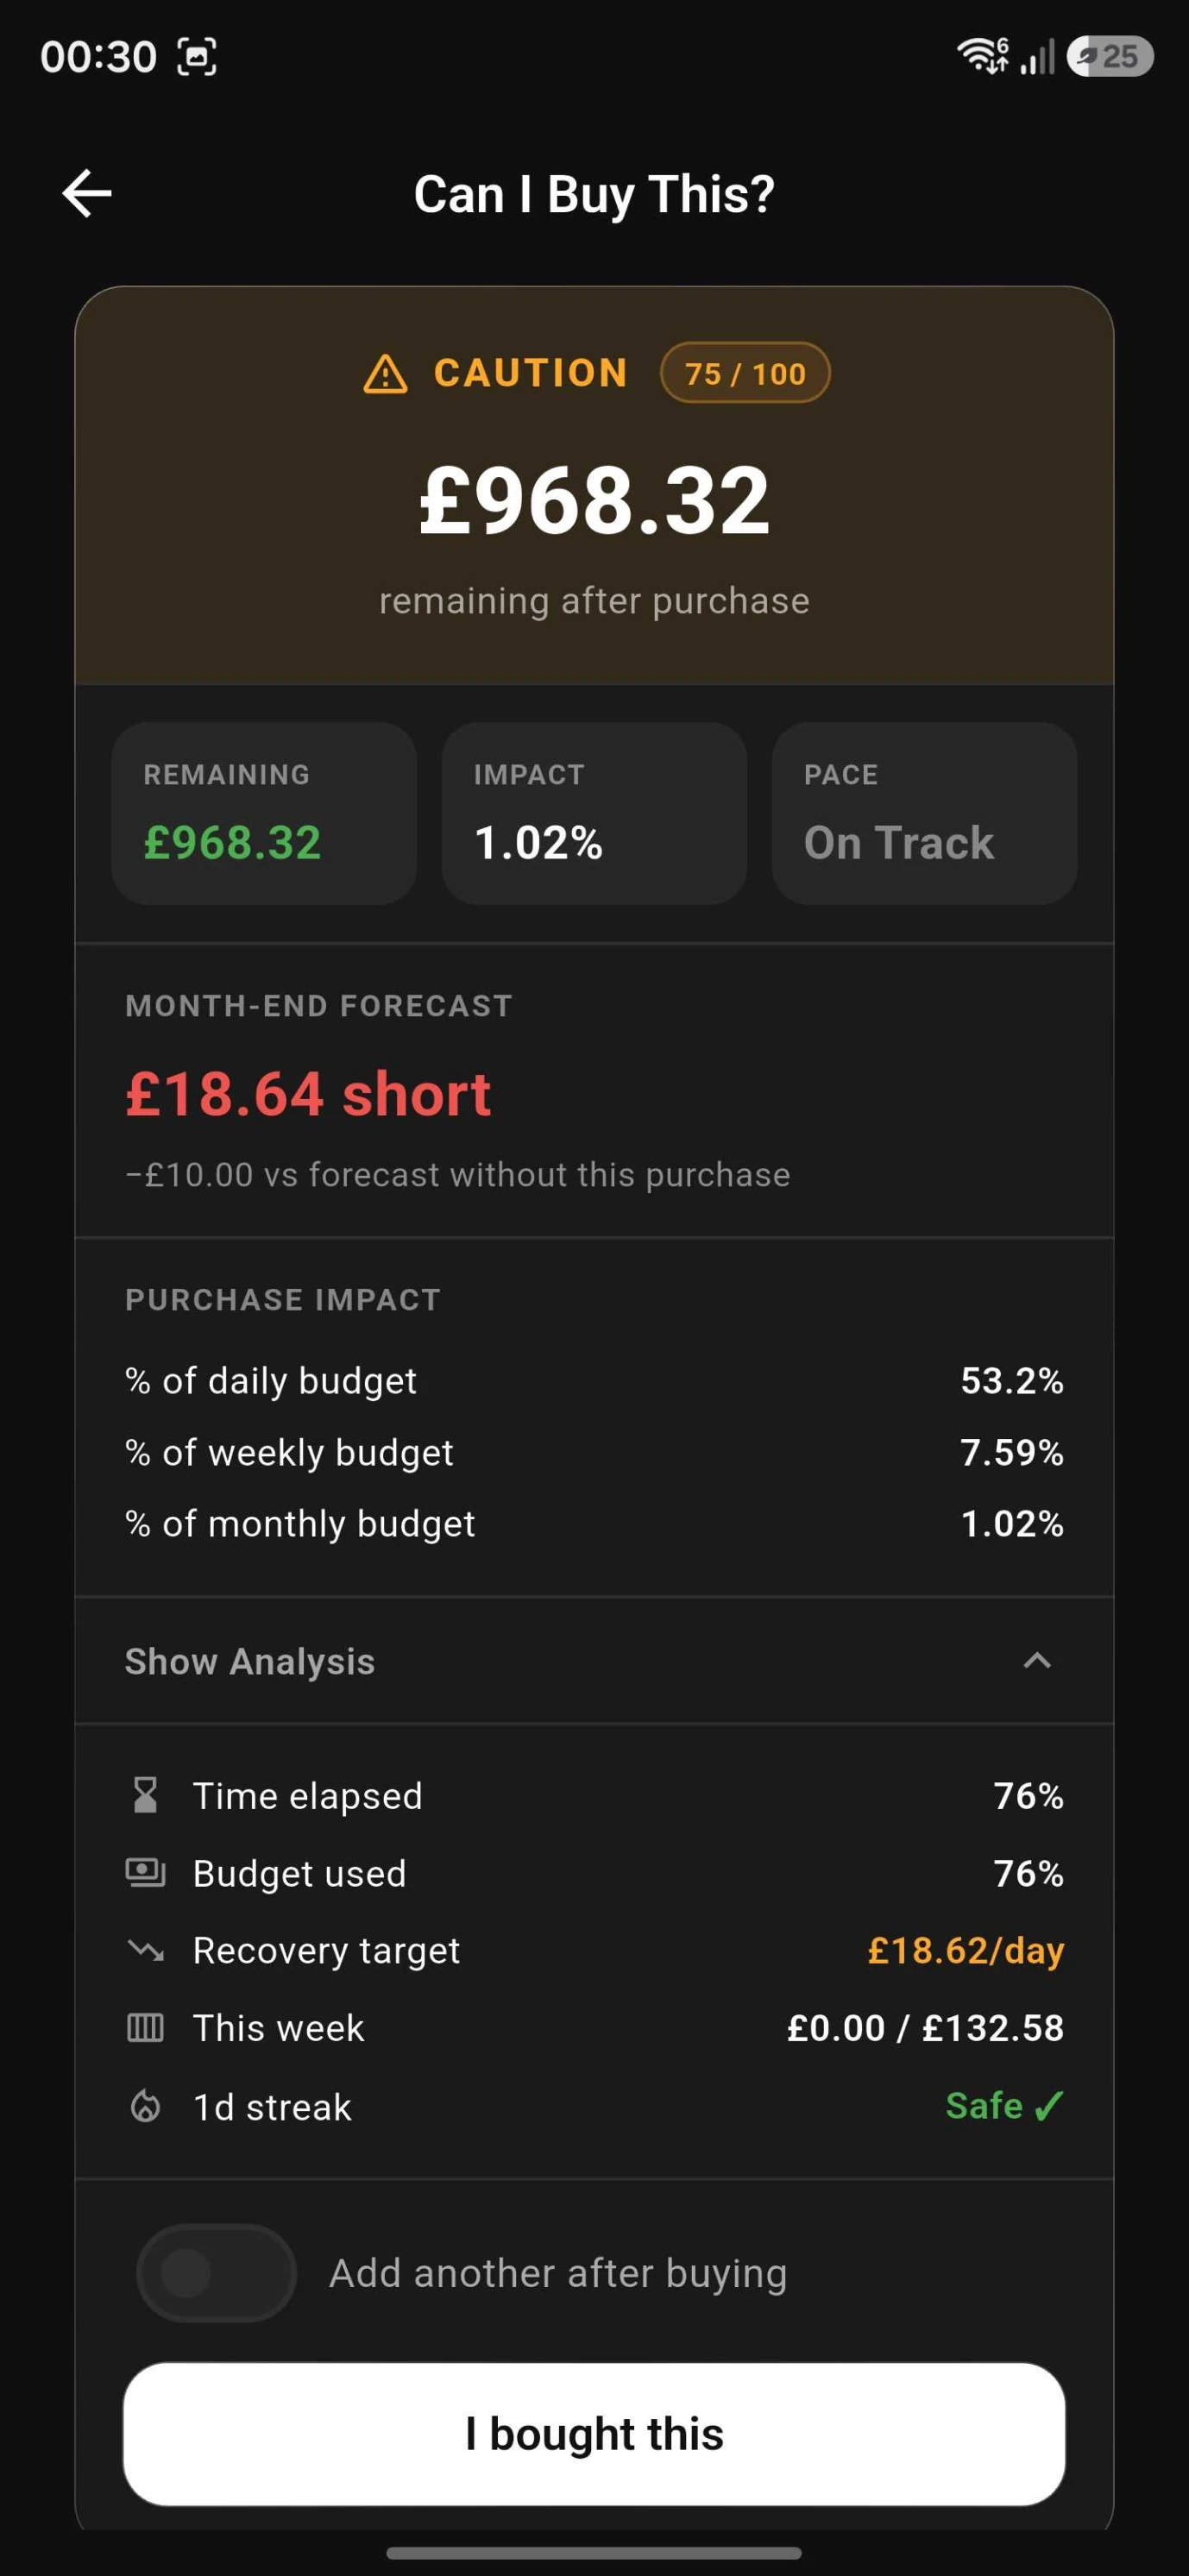
0.3The caution path: a purchase that would put you short.
Image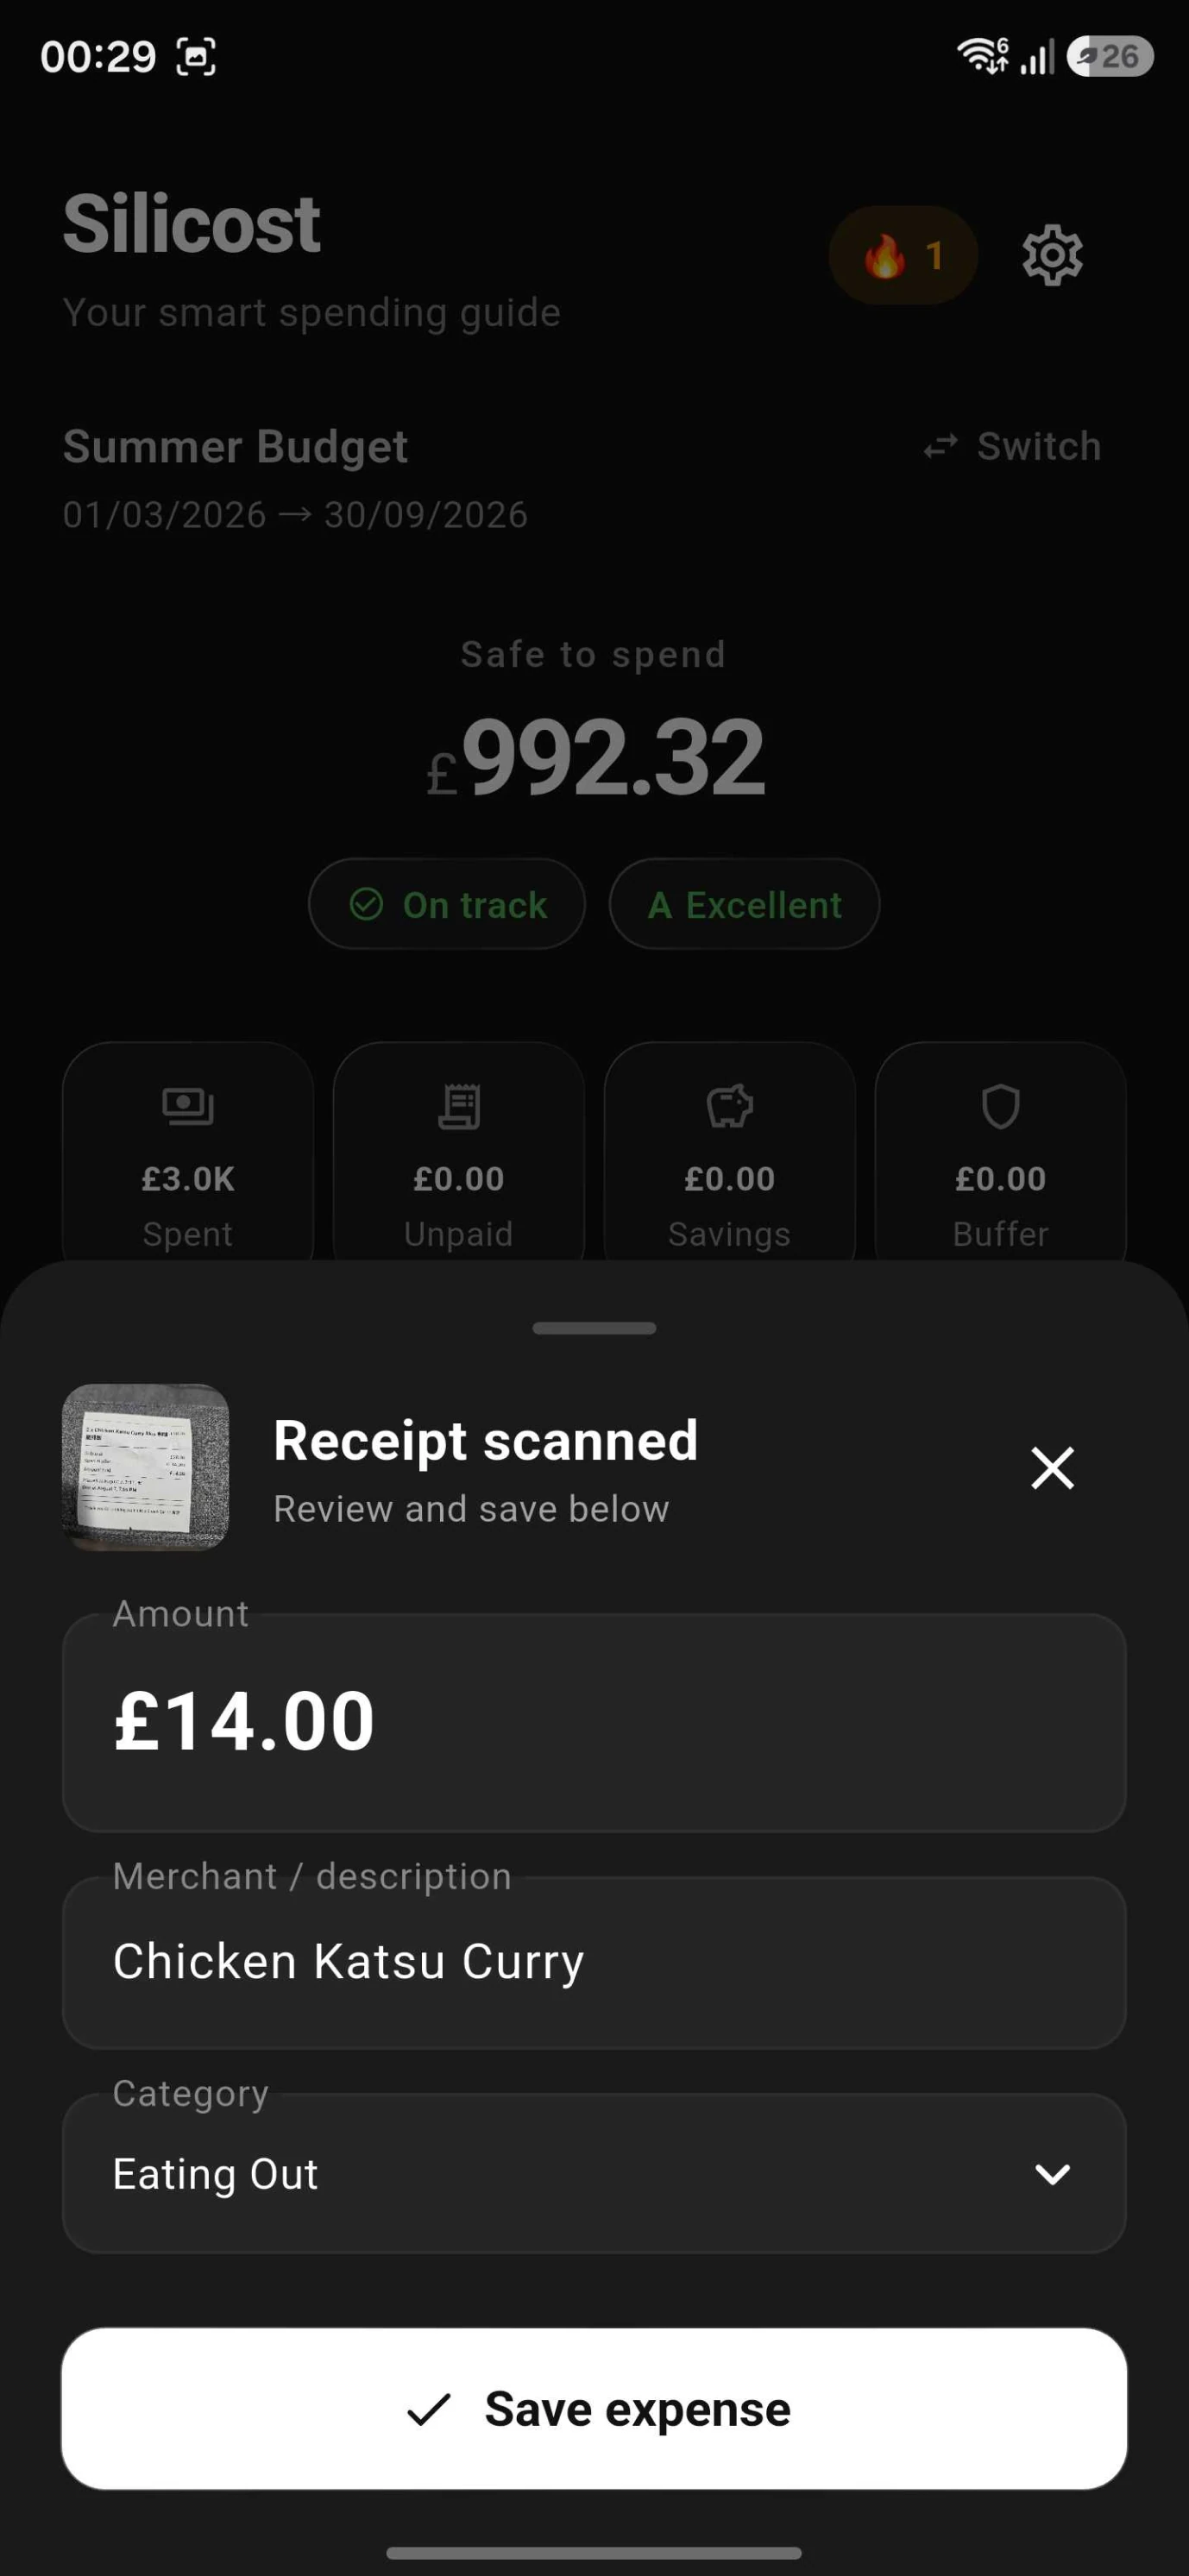
0.4Scan a receipt, auto-fill the expense.
ImageThe Problem
Knowing you have money isn't the same as knowing you can afford to spend it.
Budgeting shouldn't require you to constantly do the maths.
Managing a budget can quickly become difficult when you have to constantly calculate upcoming expenses, track how much you have left, and work out whether a purchase will leave you short later in the month. Most budgeting tools focus on recording transactions rather than answering the immediate question: “Can I afford this?” Silicost was created to make that decision simpler by turning a user's income, expenses, and spending habits into a clear daily spending limit and an immediate view of what they can safely spend.
Process
I focused on making the decision, not just tracking the money.
The idea was to build a budgeting tool around the question users actually care about.
Most budgeting apps are good at recording what already happened and worse at helping with what happens next. Rather than build another transaction tracker, I focused on turning financial data into something immediately useful, starting with the daily spending limit, a single number reflecting the current budget and upcoming expenses. From there I added the affordability check and spending insights, including statistics and a daily heatmap, to cover both individual purchases and wider spending habits. The result is a budgeting app built to guide decisions, not just report them.
Category Breakdown
See where your money actually goes
Break spending down, then dig into the details.
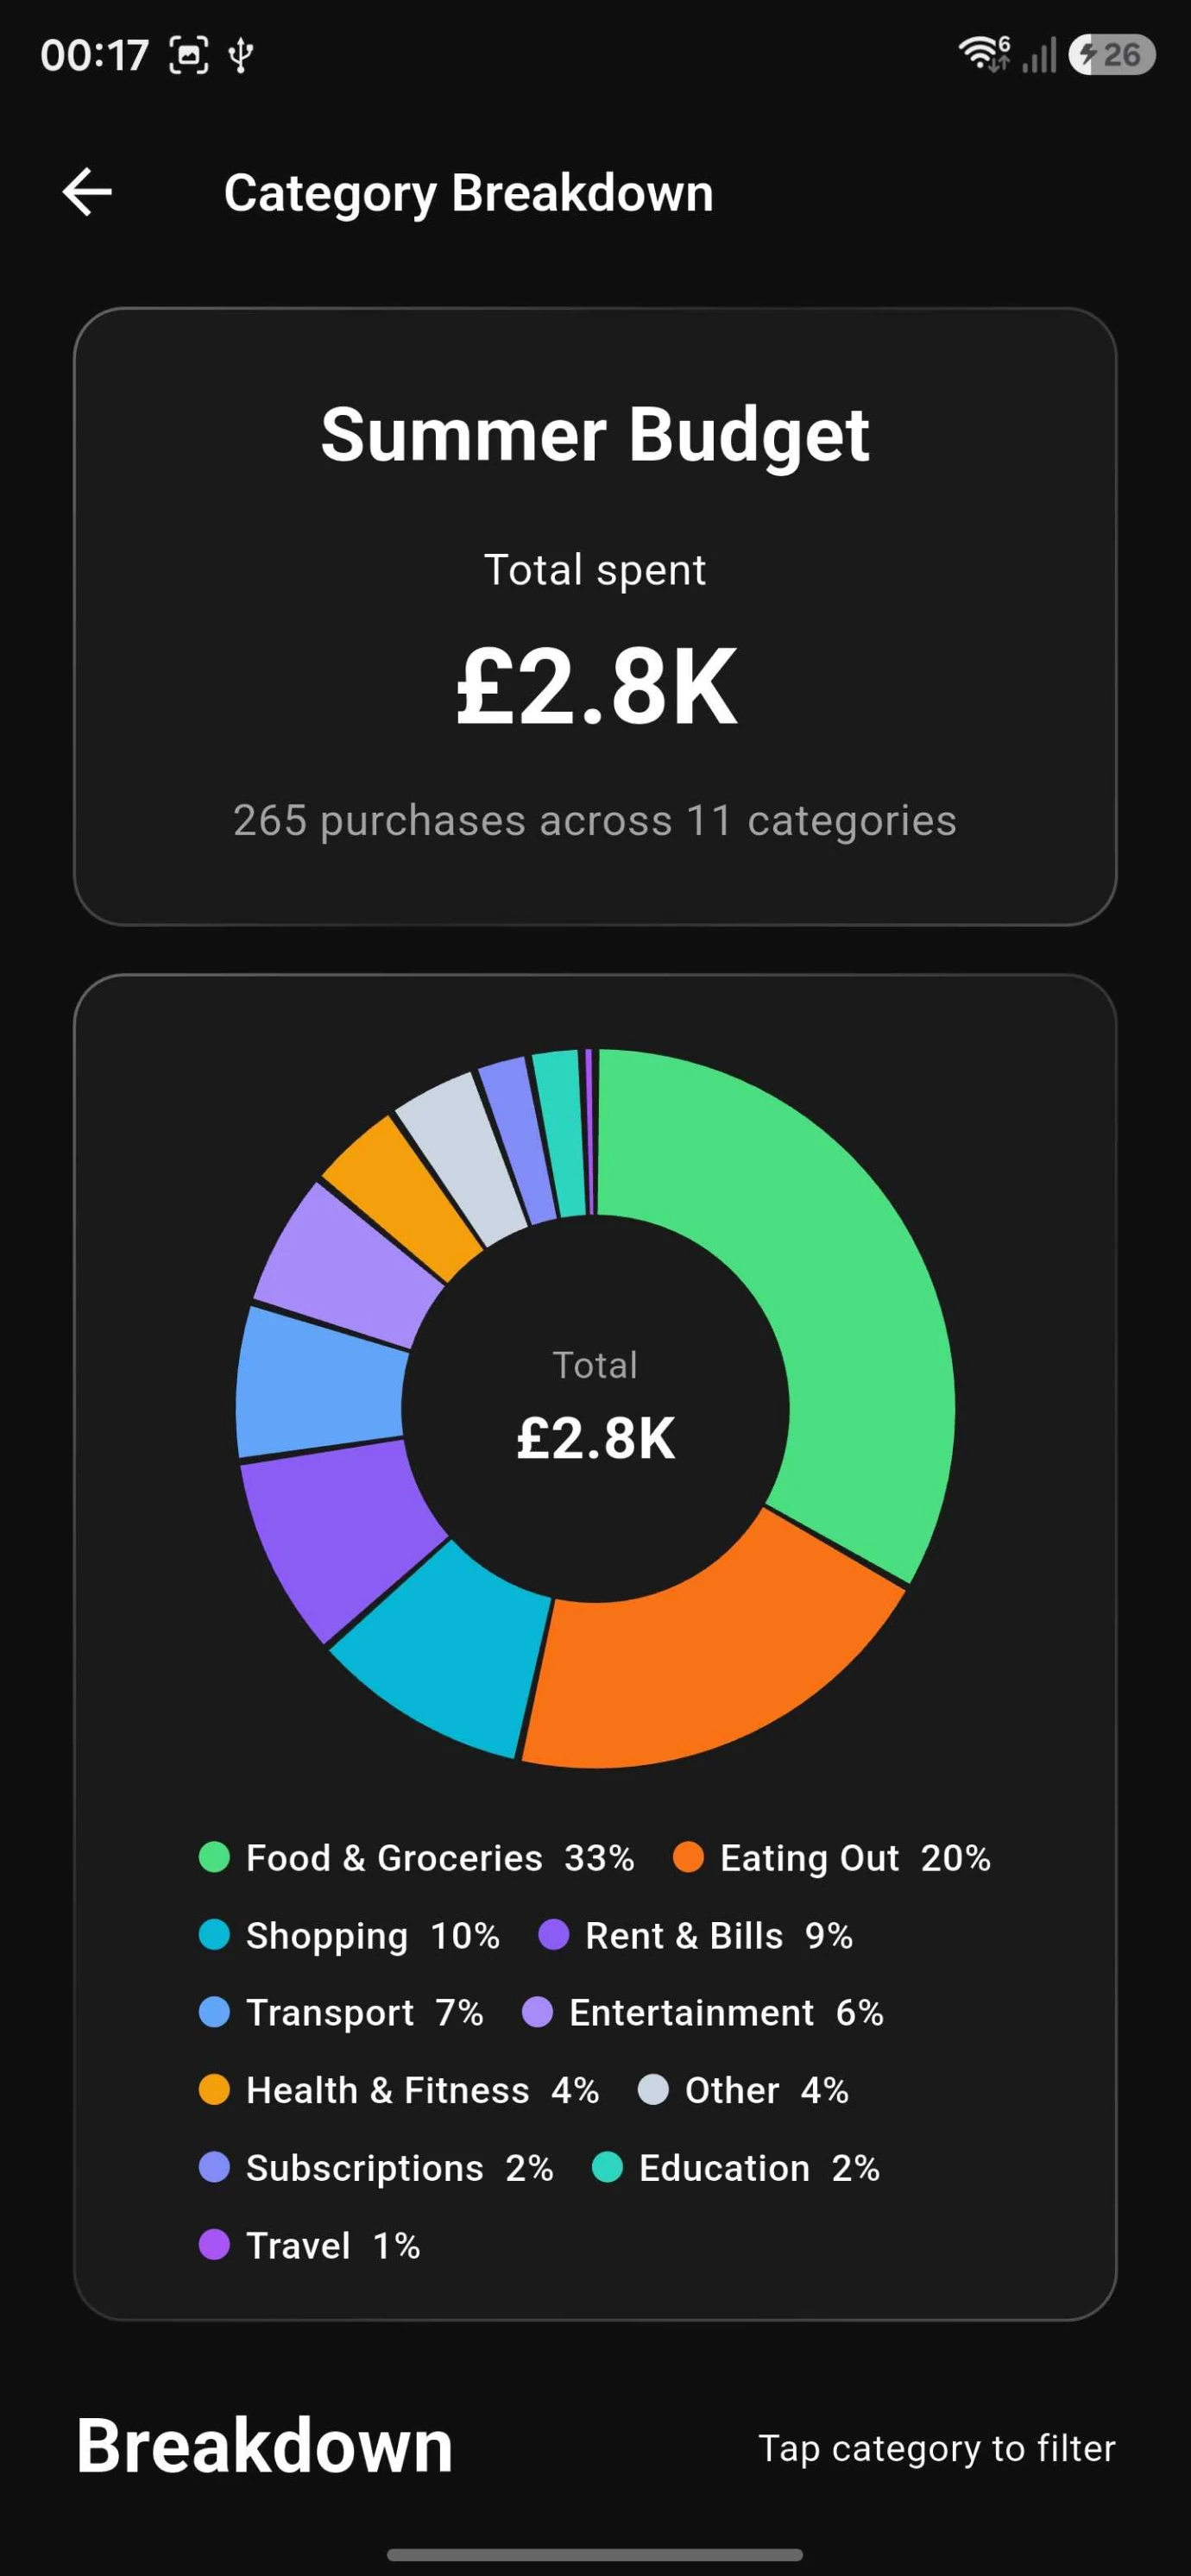
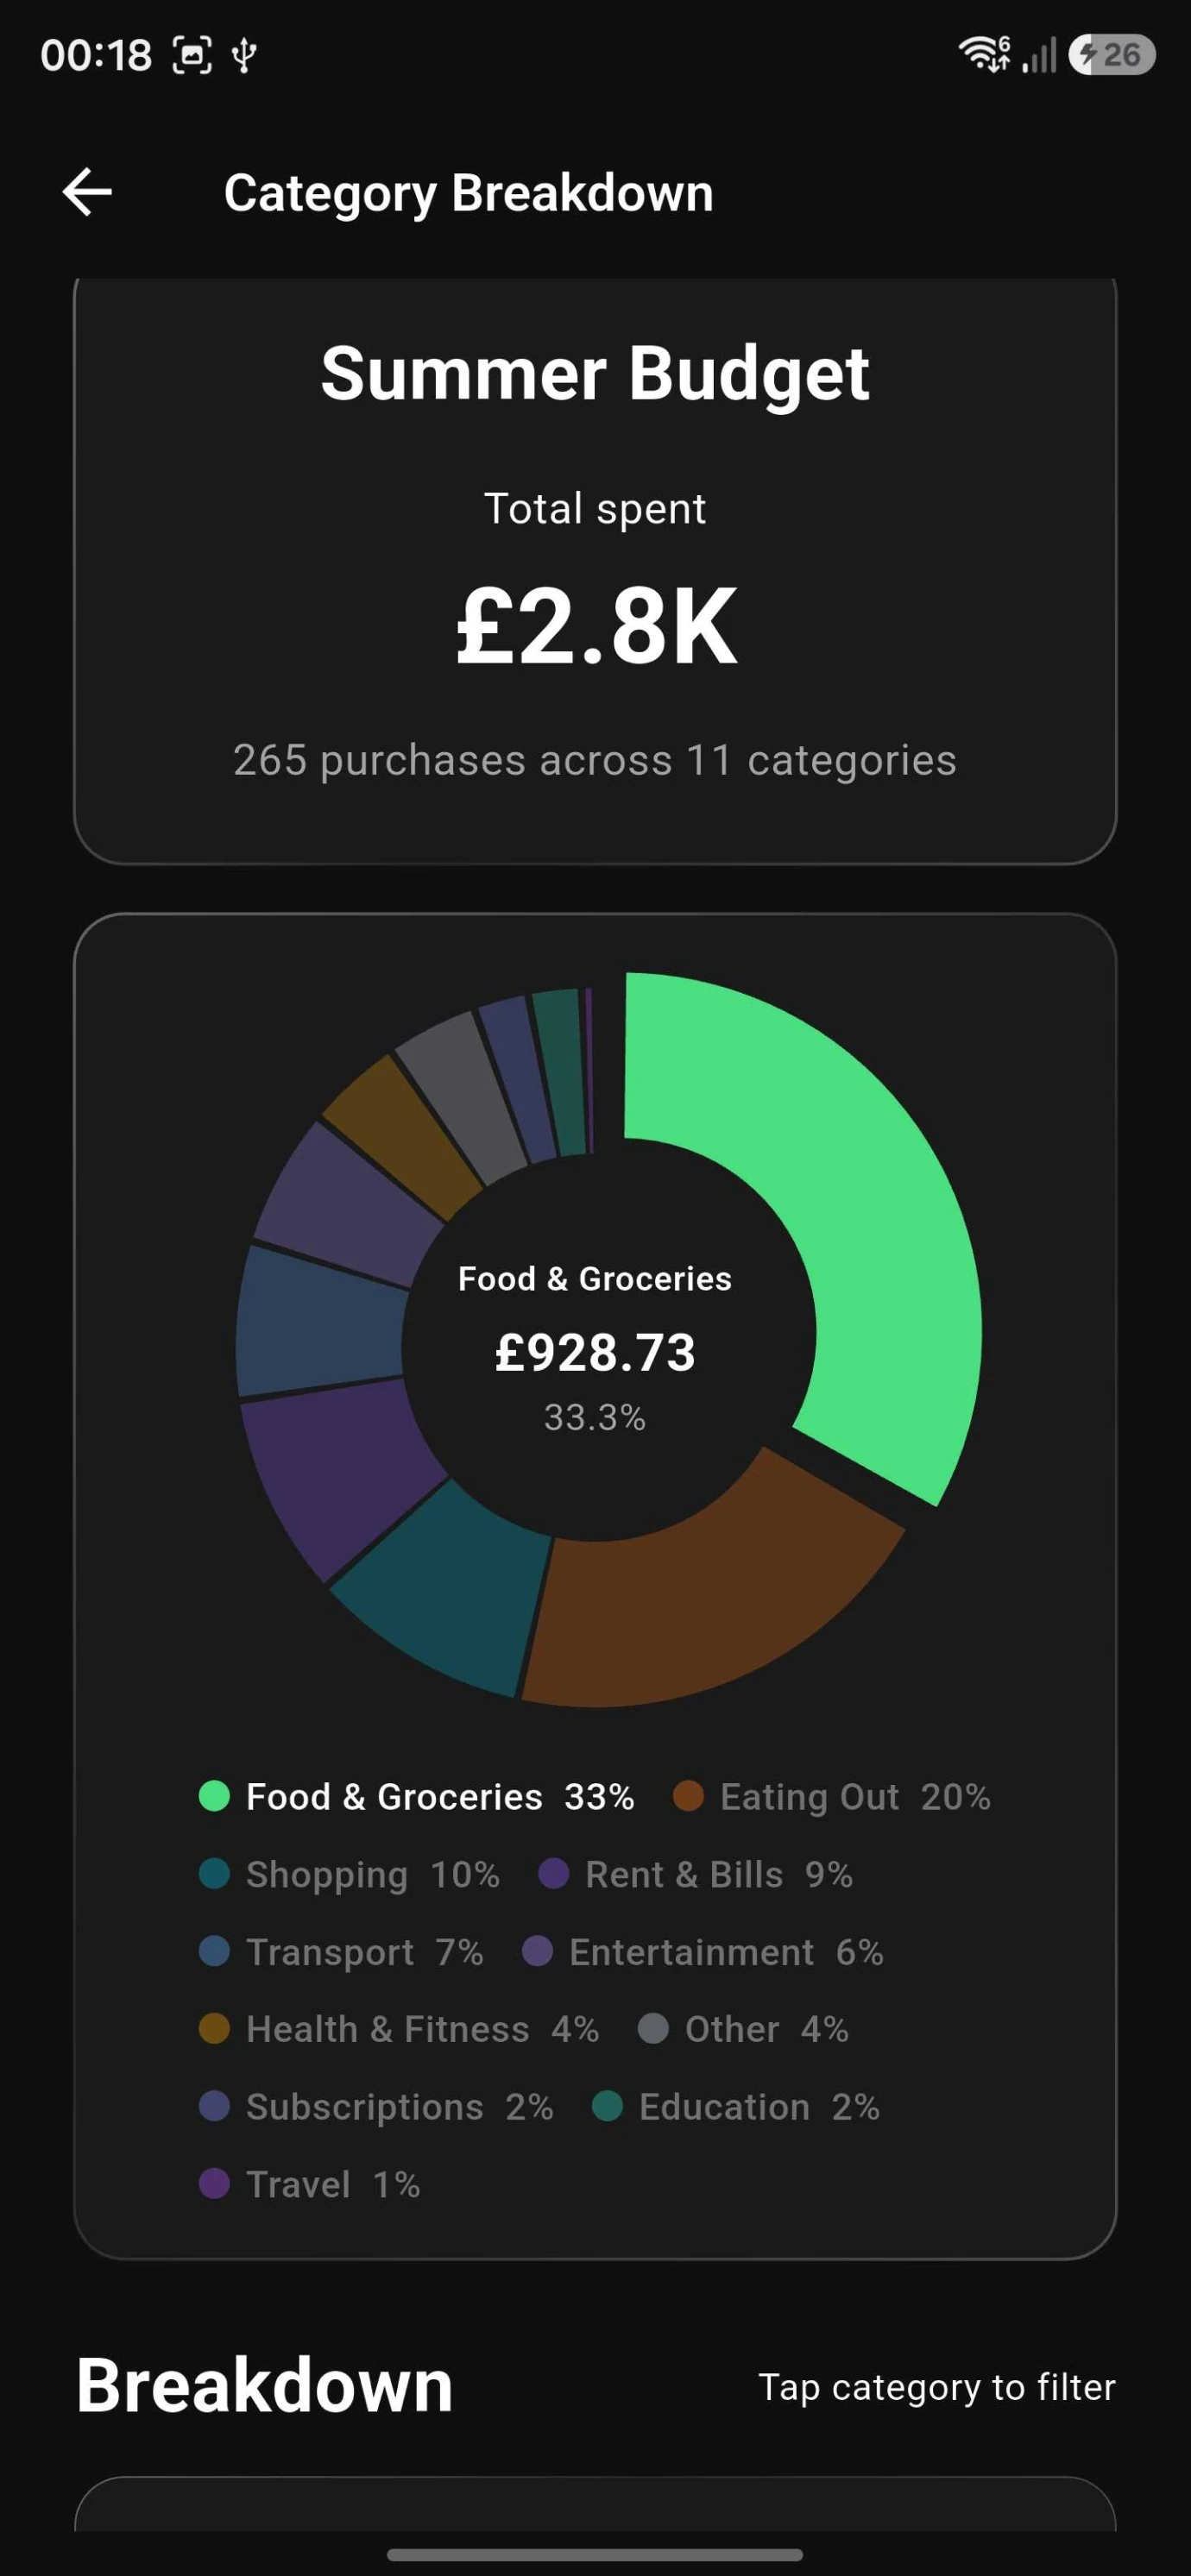
The category breakdown uses a donut chart to give users a quick view of how their spending is distributed across categories such as food, transport, shopping, and entertainment. Each slice represents a share of their total spending, making it easy to spot where most of their money is going. Tapping a category filters the view down to that specific slice, allowing users to see exactly how much they have spent in that category and understand their spending in more detail.
Solution
A budget that answers the question before you spend.
Everything users need to make a spending decision, in one place.
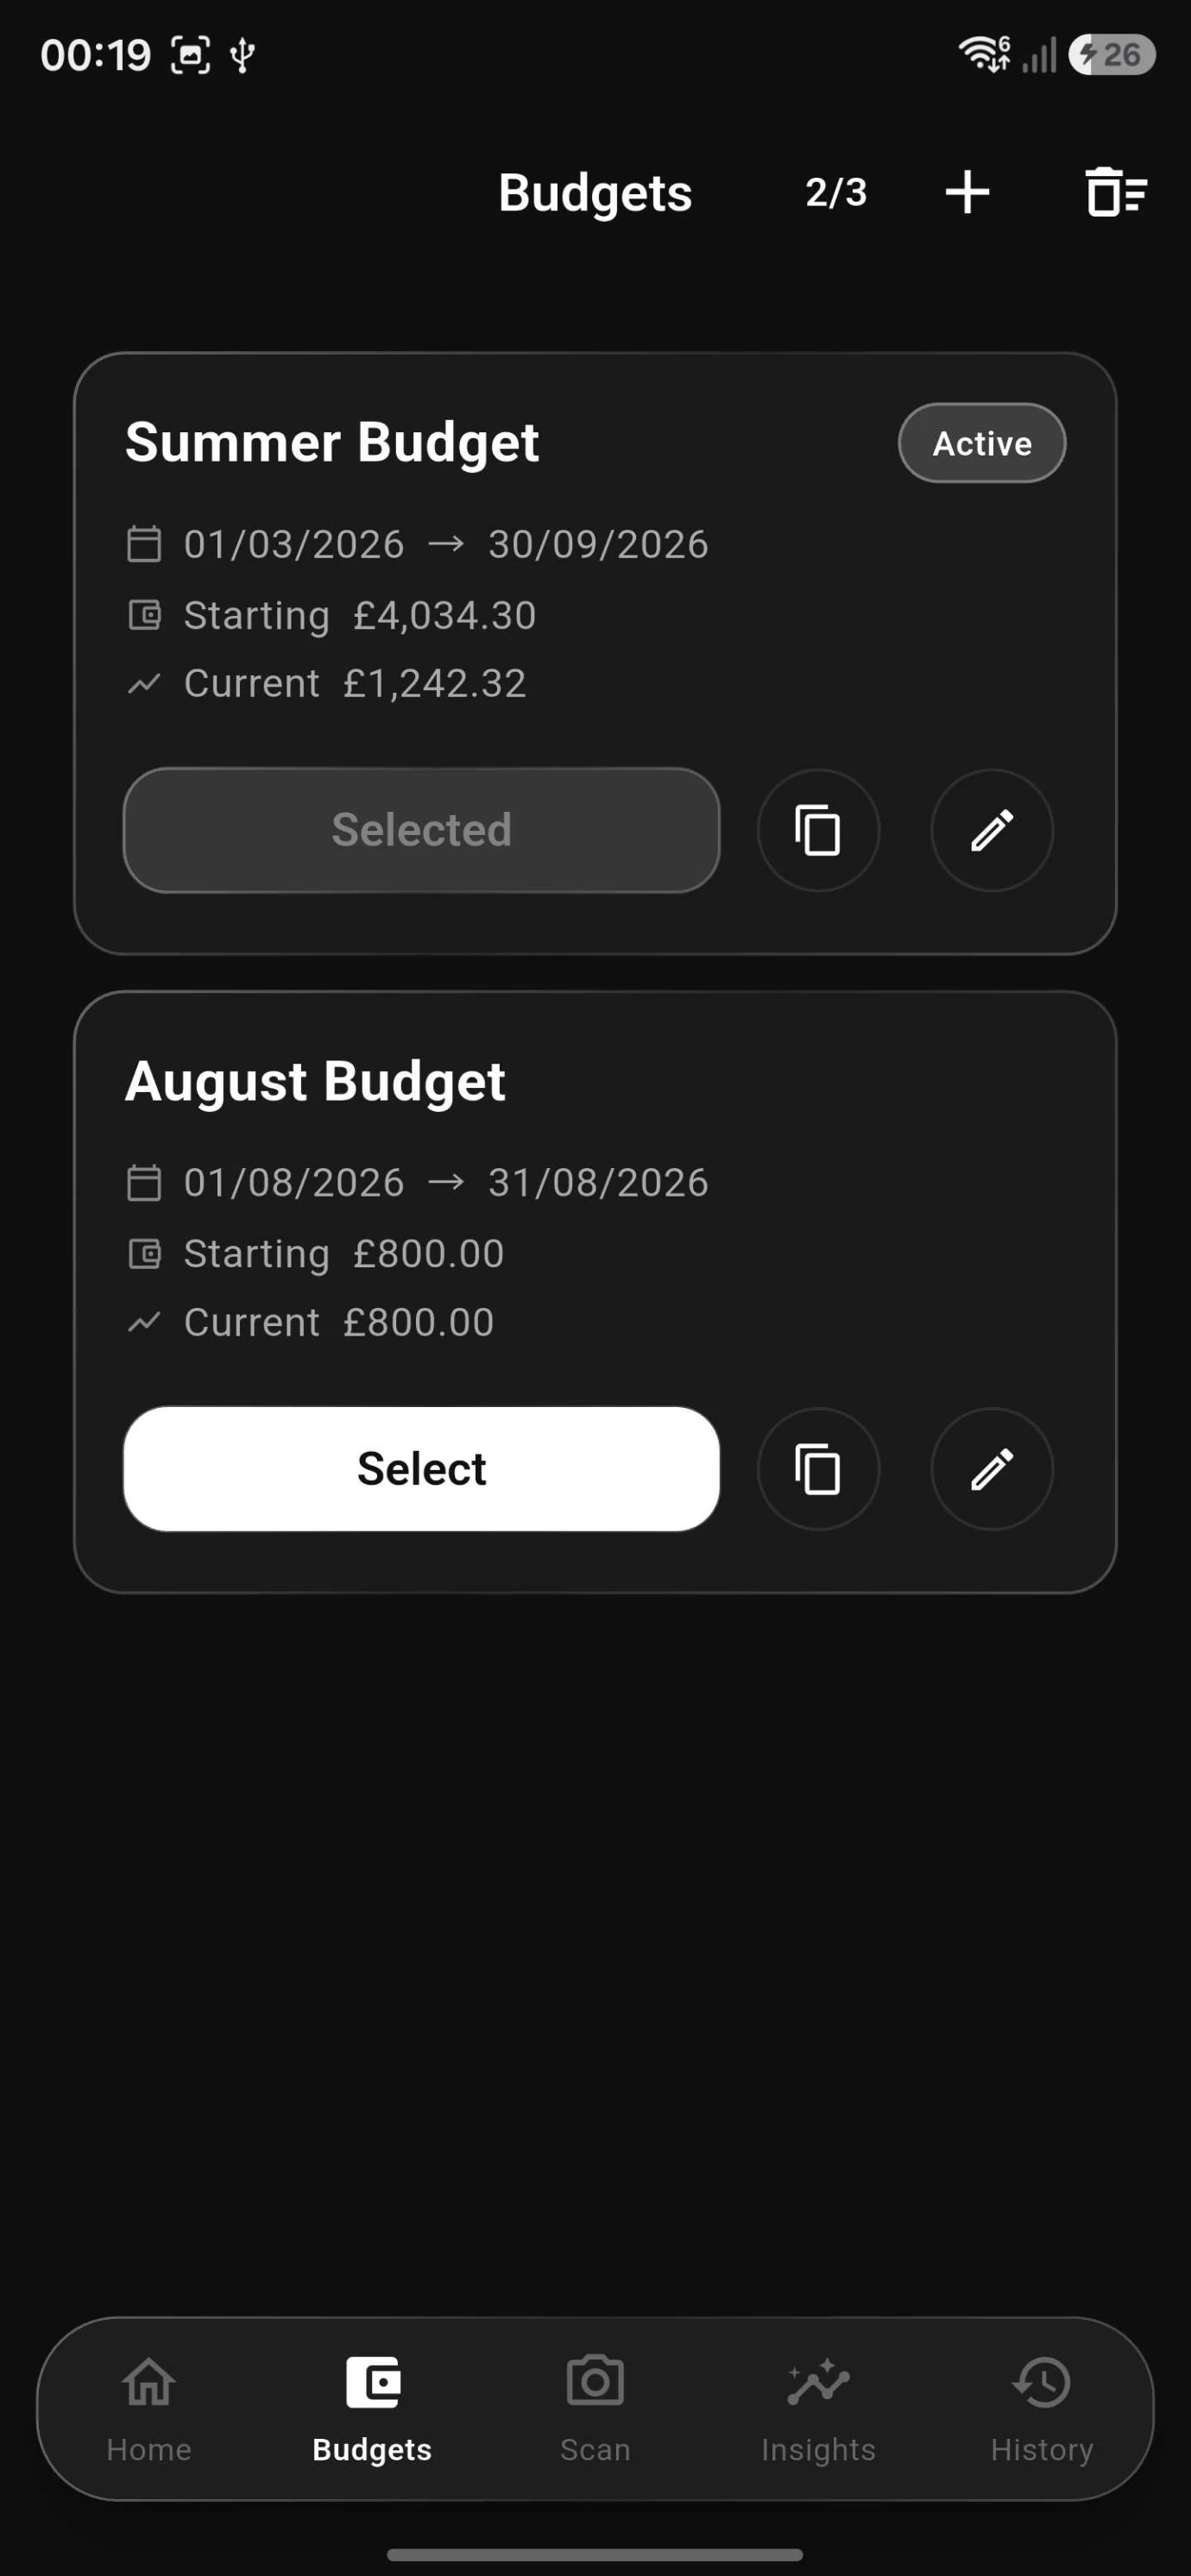
Everything sits on one dashboard: the daily spending limit, affordability checks, spending statistics, category breakdowns, and daily insights. Instead of making users work out their own finances, the app turns income and expenses into information they can act on immediately, shifting budgeting from tracking numbers to understanding what's actually affordable.
Outcome
In Development
The project is still being developed and refined based on how the experience feels in practice.
Development has focused on turning the core budgeting logic into a simple, reliable experience. As features were added, the focus shifted from simply showing financial information to making that information useful at a glance. Building the daily spending limit, affordability checks, insights, and interactive category breakdown also highlighted the importance of presenting financial data clearly without overwhelming the user. The project is continuing to evolve, with future iterations focused on improving the accuracy of budgeting calculations, refining the user experience, and adding features that make managing money more practical.